Page 190 - ePaper
P. 190
Employment and Social Developments in Europe 2014
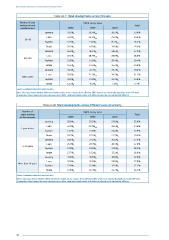
Table A4.7: Trend developments across firm size
Number of paid EWCS survey wave
workers in local Total
establishment 2000 2005 2010
Learning 41.5 % a 39.5 % a, b 38.3 % b 39.8 %
Lean 23.0 % a 24.1 % a, b 25.8 % b 24.4 %
10–49
Taylorist 15.3 % a 17.7 % b 16.1 % a, b 16.3 %
Simple 20.2 % a 18.6 % a 19.8 % a 19.6 %
Learning 36.8 % a 40.1 % b 34.6 % c 37.0 %
Lean 27.1 % a 28.7 % a, b 29.9 % b 28.6 %
50–499
Taylorist 21.0 % a 19.8 % a 20.4 % a 20.4 %
Simple 15.1 % a 11.3 % b 15.2 % a 14.0 %
Learning 38.4 % a 41.3 % a 39.1 % a 39.4 %
Lean 31.1 %
500 or over 28.6 % a 31.2 % a, b 34.7 % b
Taylorist 20.8 % a 19.0 % a 19.1 % a 19.8 %
Simple 12.2 % a 8.5 % b 7.1 % b 9.7 %
Source: Eurofound estimates based on EWCS.
Note: Subscripts denote whether difference between values across columns (from different EWCS waves) are statistically significant at the 0.05 level.
In particular, values having the same subscripts do not differ significantly while values with different subscripts are significantly different.
Table A4.8: Trend developments across different levels of seniority
Number of EWCS survey wave
years working Total
at the company 2000 2005 2010
Learning 35.0 % a 35.3 % a 27.8 % b 32.9 %
Lean 24.6 %
1 year or less 23.0 % a 24.9 % a, b 26.5 % b
Taylorist 21.7 % a 23.0 % a 24.4 % a 22.9 %
Simple 20.3 % a 16.7 % b 21.3 % a 19.6 %
Learning 38.6 % a 37.5 % a 36.6 % a 37.5 %
Lean 25.9 % a 28.4 % b 28.4 % b 27.6 %
2–10 years
Taylorist 17.8 % a 18.9 % a 17.8 % a 18.1 %
Simple 17.7 % a 15.2 % b 17.2 % a 16.8 %
Learning 41.6 % a 46.3 % b 40.8 % a 42.6 %
Lean 27.9 %
More than 10 years 26.8 % a 26.9 % a 29.9 % b
Taylorist 17.9 % a 16.4 % a 16.6 % a 17.1 %
Simple 13.6 % a 10.4 % b 12.7 % a 12.4 %
Source: Eurofound estimates based on EWCS.
Notes: Subscripts denote whether difference between values across columns (from different EWCS waves) are statistically significant at the 0.05 level.
In particular, values having the same subscripts do not differ significantly while values with different subscripts are significantly different.
188