Page 189 - ePaper
P. 189
Chapter 3: The future of work in Europe: job quality and work organisation for a smart, sustainable and inclusive growth
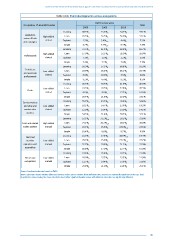
Table A4.6: Trend developments across occupations
EWCS survey wave
Occupation: 1 -level ISCO codes Total
st
2000 2005 2010
Learning 68.5 % a 55.6 % b 54.3 % b 59.1 %
Legislators, Lean 33.1 %
senior officials High-skilled 26.5 % a 36.3 % b 36.0 % b
clerical
and managers Taylorist 2.3 % a 3.4 % a, b 4.4 % b 3.5 %
Simple 2.7 % a 4.7 % a, b 5.4 % b 4.3 %
Learning 72.5 % a 61.8 % b 68.4 % a 66.7 %
High-skilled Lean 17.0 % a 32.1 % b 26.0 % c 26.0 %
Professionals
clerical Taylorist 7.1 % a 2.9 % b 2.2 % b 3.9 %
Simple 3.4 % a 3.2 % a 3.4 % a 3.3 %
Learning 58.9 % a 57.1 % a 60.8 % a 59.3 %
Technicians Lean 25.4 %
and associate Low-skilled 23.9 % a 26.5 % a 26.1 % a
clerical
professionals Taylorist 8.0 % a 10.0 % a 3.9 % b 6.8 %
Simple 9.2 % a 6.4 % b 9.2 % a 8.5 %
Learning 46.5 % a 50.3 % a 41.9 % b 46.0 %
Low-skilled Lean 19.5 % a 18.3 % a 22.8 % b 20.3 %
Clerks
clerical Taylorist 8.6 % a 9.6 % a 13.3 % b 10.6 %
Simple 25.4 % a 21.8 % b 22.0 % b 23.1 %
Learning 34.6 %
Service workers 35.7 % a 43.5 % b 26.4 % c
and shop and Low-skilled Lean 18.1 % a 14.7 % a 23.9 % b 19.2 %
market sales clerical Taylorist 12.0 % a 10.4 % a 19.0 % b 14.1 %
workers Simple 34.3 % a 31.4 % a 30.7 % a 32.1 %
Learning 33.1 % a 31.2 % a, b 30.2 % b 31.6 %
Craft and related High-skilled Lean 34.1 % a 36.3 % a, b 38.1 % b 36.0 %
trades workers manual Taylorist 22.4 % a 25.6 % b 23.0 % a, b 23.5 %
Simple 10.4 % a 6.8 % b 8.7 % a 8.9 %
Plant and Learning 21.3 % a 17.3 % b 18.9 % a, b 19.4 %
machine Low-skilled Lean 29.2 % a 25.8 % b 27.2 % a, b 27.7 %
operators and manual Taylorist 32.7 % a 39.8 % b 31.2 % a 33.9 %
assemblers Simple 16.8 % a 17.0 % a 22.7 % b 19.0 %
Learning 19.6 % a 26.4 % b 18.2 % a 21.4 %
Elementary Low-skilled Lean 18.9 % a 23.3 % b 23.5 % b 21.9 %
occupations manual Taylorist 31.7 % a 29.4 % a 33.9 % a 31.6 %
Simple 29.8 % a 21.0 % b 24.4 % b 25.1 %
Source: Eurofound estimates based on EWCS.
Notes: Subscripts denote whether difference between values across columns (from different EWCS waves) are statistically significant at the 0.05 level.
In particular, values having the same subscripts do not differ significantly while values with different subscripts are significantly different.
187