Page 117 - ePaper
P. 117
Chapter 2: Investing in human capital and responding to long-term societal challenges
3.2. Maintaining human participate in continuous vocational train - relevant not only from a public finance
capital ing. Unsurprisingly, these countries also perspective, but also in terms of effective -
have significantly lower NEET rates and ness of the investment, as enterprises can
The dynamic character of human capi- higher employment rates. The differences fine-tune and adapt training programmes
tal accumulation implies that the skills between the most competitive and least to their specific needs.
acquired at one stage form the basis competitive countries can be observed.
from which further steps can be made On the input side, the biggest gaps are In general, training provided by the public
63
throughout the life-cycle ( ), with the in terms of participation rates and of the and private sectors can be seen as both
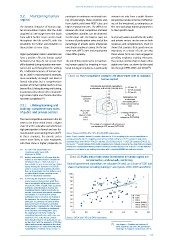
possibility for further accumulation or percentage of private sector enterprises necessary and complementary. Chart 15
depreciation at every stage. investing in employee training. On the out - shows that countries that spend more on
come side, NEET rates and employment education, as a share of GDP, are also
Higher participation rates in education can rates differ greatly. those whose firms are more engaged in
have a positive effect on human capital providing employee training. Moreover,
formation, but they do not ensure that The role of the private sector in maintain - this positive relationship has been rather
skills obtained during education are main - ing human capital, by investing in voca- stable over time, as shown by the trend
66
tained and used throughout the working tional training of employees, is particularly line through 1999, 2005 and 2010 ( ).
life. Traditional measures of human capi-
tal, as used in macroeconomic analyses, Chart 14: More competitive countries are those more able to maintain
focus essentially on length and level of human capital
formal education, but a comprehensive
analysis of human capital needs to move Total general government expenditures
beyond this. Lifelong learning and training, in education, in % of GDP [COFOG] 2011 EU last 15
EU-28 average
in particular, play critical roles in maintain- 1.0 EU top 15
ing human capital once formal education Employment 0.8 Participation rate
has been completed. ( ) rate [LFS] 0.6 in education
64
2011 0.4 and training [AES]
0.2 Formal & non-formal
3.2.1. Lifelong learning and 0 2011
training: complementary roles
of public and private sectors NEETs rate Training enterprises
15-29
(inverse scale) as % of all
[LFS]
The most competitive countries in the EU 2011 enterprises [CVT] 2010
seem to be those which invest a higher Percentage of employees (all enterprises)
share of GDP in education and which have participating in CVT courses [CVT] 2010
high participation in formal and non-for-
mal education and training (Chart 14) ( ). Source: Eurostat (COFOG, AES, CVTS, LFS), DG EMPL elaborations.
65
In these countries, the private sector Notes: *Top EU countries include EU countries that were in 2014, according to the overall competitiveness
seems more likely to train employees, ranking, among the top 15 competitive countries (out of 60) and the last 15 EU countries includes those
ranking in places from 46–60. **TOP_EU countries: SE, DE, DK, LU, NL, IE. *** LAST_EU countries: IT, HU, SI, EL,
who then show a higher propensity to RO, BG, HR. ****Overall ranking of the World Competitiveness Yearbook is based on four main factors: Economic
Performance; Government Efficiency; Business Efficiency and Infrastructure. The scale 0 to 1 for the different
63
( ) So called ‘self-productivity’ and indicators is calculated by normalising their values with a standard MAX/MIN normalisation formula.
‘complementarity’ upon skills
(Cunha et al. 2006).
64
( ) Beblavy and Maselli (2014) argue that the Chart 15: Public and private sector investments in human capital are
number of low-skilled workers shouldn’t be complementary and mutually reinforcing
considered only as a stock, but also as a
flow variable, as one can become low-skilled General government expenditure on education (X-axis), as a share of GDP, and
during working life. Kurekova et al (2013) share of enterprises providing training (Y-axis) (years 1999, 2005 and 2010)
point to structural and institutional barriers
that can draw people into low-skillness such
as technological change, growing service 100
sector or educational expansion.
( ) In assessing the importance of training, 90
65
several measures have proved useful. They 80
have materialised in different indicators that
measure the efforts of public finances, private 70
enterprises and individuals in forming and 60
maintaining human capital. In particular, we
consider: total general government expenditure 50
on education, as a share of GDP; overall 40 1999
participation rate in education and training of 2005
the population; the percentage of employees 30 2010
taking part in continuous vocational training 20 Linear (1999)
courses; the share of enterprises providing Linear (2005)
training for their employees; the rate of young 10 Linear (2010)
people (aged 15–29) neither in employment
nor in education and training (NEET rate); 0
the employment rate in the country. By 2.5 3.5 4.5 5.5 6.5 7.5 8.5
normalising these indicators, with a max-min
method, in a 0–1 scale, we can compare Sources: COFOG and CVTS, DG EMPL elaborations.
them directly in Chart 14. In particular, we can
compare them with the aggregates of Member
States used previously according to their level ( ) See chapter 5 ‘Markets and systems of
66
of competitiveness as stated in the IMD World adult education and CVET: the governance
Competitiveness Yearbook 2014 (see Box 2). challenge’ in European Commission, 2013b.
115
3.2. Maintaining human participate in continuous vocational train - relevant not only from a public finance
capital ing. Unsurprisingly, these countries also perspective, but also in terms of effective -
have significantly lower NEET rates and ness of the investment, as enterprises can
The dynamic character of human capi- higher employment rates. The differences fine-tune and adapt training programmes
tal accumulation implies that the skills between the most competitive and least to their specific needs.
acquired at one stage form the basis competitive countries can be observed.
from which further steps can be made On the input side, the biggest gaps are In general, training provided by the public
63
throughout the life-cycle ( ), with the in terms of participation rates and of the and private sectors can be seen as both
possibility for further accumulation or percentage of private sector enterprises necessary and complementary. Chart 15
depreciation at every stage. investing in employee training. On the out - shows that countries that spend more on
come side, NEET rates and employment education, as a share of GDP, are also
Higher participation rates in education can rates differ greatly. those whose firms are more engaged in
have a positive effect on human capital providing employee training. Moreover,
formation, but they do not ensure that The role of the private sector in maintain - this positive relationship has been rather
skills obtained during education are main - ing human capital, by investing in voca- stable over time, as shown by the trend
66
tained and used throughout the working tional training of employees, is particularly line through 1999, 2005 and 2010 ( ).
life. Traditional measures of human capi-
tal, as used in macroeconomic analyses, Chart 14: More competitive countries are those more able to maintain
focus essentially on length and level of human capital
formal education, but a comprehensive
analysis of human capital needs to move Total general government expenditures
beyond this. Lifelong learning and training, in education, in % of GDP [COFOG] 2011 EU last 15
EU-28 average
in particular, play critical roles in maintain- 1.0 EU top 15
ing human capital once formal education Employment 0.8 Participation rate
has been completed. ( ) rate [LFS] 0.6 in education
64
2011 0.4 and training [AES]
0.2 Formal & non-formal
3.2.1. Lifelong learning and 0 2011
training: complementary roles
of public and private sectors NEETs rate Training enterprises
15-29
(inverse scale) as % of all
[LFS]
The most competitive countries in the EU 2011 enterprises [CVT] 2010
seem to be those which invest a higher Percentage of employees (all enterprises)
share of GDP in education and which have participating in CVT courses [CVT] 2010
high participation in formal and non-for-
mal education and training (Chart 14) ( ). Source: Eurostat (COFOG, AES, CVTS, LFS), DG EMPL elaborations.
65
In these countries, the private sector Notes: *Top EU countries include EU countries that were in 2014, according to the overall competitiveness
seems more likely to train employees, ranking, among the top 15 competitive countries (out of 60) and the last 15 EU countries includes those
ranking in places from 46–60. **TOP_EU countries: SE, DE, DK, LU, NL, IE. *** LAST_EU countries: IT, HU, SI, EL,
who then show a higher propensity to RO, BG, HR. ****Overall ranking of the World Competitiveness Yearbook is based on four main factors: Economic
Performance; Government Efficiency; Business Efficiency and Infrastructure. The scale 0 to 1 for the different
63
( ) So called ‘self-productivity’ and indicators is calculated by normalising their values with a standard MAX/MIN normalisation formula.
‘complementarity’ upon skills
(Cunha et al. 2006).
64
( ) Beblavy and Maselli (2014) argue that the Chart 15: Public and private sector investments in human capital are
number of low-skilled workers shouldn’t be complementary and mutually reinforcing
considered only as a stock, but also as a
flow variable, as one can become low-skilled General government expenditure on education (X-axis), as a share of GDP, and
during working life. Kurekova et al (2013) share of enterprises providing training (Y-axis) (years 1999, 2005 and 2010)
point to structural and institutional barriers
that can draw people into low-skillness such
as technological change, growing service 100
sector or educational expansion.
( ) In assessing the importance of training, 90
65
several measures have proved useful. They 80
have materialised in different indicators that
measure the efforts of public finances, private 70
enterprises and individuals in forming and 60
maintaining human capital. In particular, we
consider: total general government expenditure 50
on education, as a share of GDP; overall 40 1999
participation rate in education and training of 2005
the population; the percentage of employees 30 2010
taking part in continuous vocational training 20 Linear (1999)
courses; the share of enterprises providing Linear (2005)
training for their employees; the rate of young 10 Linear (2010)
people (aged 15–29) neither in employment
nor in education and training (NEET rate); 0
the employment rate in the country. By 2.5 3.5 4.5 5.5 6.5 7.5 8.5
normalising these indicators, with a max-min
method, in a 0–1 scale, we can compare Sources: COFOG and CVTS, DG EMPL elaborations.
them directly in Chart 14. In particular, we can
compare them with the aggregates of Member
States used previously according to their level ( ) See chapter 5 ‘Markets and systems of
66
of competitiveness as stated in the IMD World adult education and CVET: the governance
Competitiveness Yearbook 2014 (see Box 2). challenge’ in European Commission, 2013b.
115