Page 114 - ePaper
P. 114
Employment and Social Developments in Europe 2014
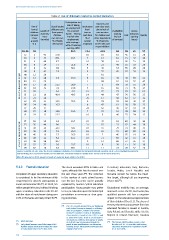
Table 2: Use of childcare related to context indicators
Participation tax Inactivity and
rate of taking
Use of Out-of-pocket up employment Involuntary part-time work
formal childcare costs fixed- due to lack of
Access
Length of
for a second
childcare maternity (lone parent, earner - Moving term or care services Availability (distance,
(waiting
(at least leave full-time into full-time part-time for children and list, lack Cost opening Quality
1 hour care net cost, % of other dependents
employment
a week) (months) % of family with earnings = women % of persons of services) hours)
0-2 net income) employed 15-64 with care
50 % of average responsibilities
earnings (AW)
EU-28 28 35.2 13.4 42.9 58 59 41 27
CZ 3 43 17.8 10 18 61 45 51 28
SK 5 44 25.1 23.7 7 14 61 71 47 38
PL 6 49 8.7 18 38 61 66 51 38
BG 8 14 7.7 21.6 4 21 49 55 33 20
LT 8 41 9.0 36.1 5 45 53 55 29 26
HU 12 42 5.9 45.9 9 37 45 63 39 36
8
Below the Barcelona target RO 15 29 21.3 28.9 15 89 62 74 57 47
7
20
81
HR
16
14
45
AT
28
21
5
4.3
43
39
1
3
64
16
35
MT
7
78
29
17
4
24.8
71
15
24
7.6
62
41
EE
45
18
63
57
78
73
5.3
72
6.5
20
EL
IE
16
37
17
IT
25
58
21
32
63
59
13.5
79
60
23
35.6
27
6
45
41
LV 21 18 40.4 49.5 14 49 47 76 36 23
DE 24 40 15.3 8 47 61 50 39 25
CY 26 8 24 52 36 47 33 19
UK 27 19 13.0 51.5 7 72 54 78 39 25
FI 29 12 21.7 15.7 16 47 46 33 34 12
6
36
22
53
42
13
63
4.0
35
PT
Above the Barcelona target ES 36 40 12.3 30.1 31 63 53 67 44 30
9.0
38
35
SI
74
70
55
15
10
46
16
25
22
50
60
7.5
72
40
25.9
40
FR
7
5.7
65
46
16
14
46
NL
10
19
36.6
42
BE
48
10
18
43.1
35
60
8.2
71
12
LU
9
28
26
5.0
37
52
SE
9
18
11
16
20
DK 48 16 10.7 23.7 18 14 60 37 35 17
67
11
43
89.1
32
7.8
37
11
Sources: Eurostat, EU-SILC 2012 (IE 2011); Fondazione Brodolini, 2013 (maternity and parental leave); Eurostat, EU-LFS 2012 (involuntary part-time
and inactivity); OECD tax-benefit model (cost of childcare); Eurofound European Quality of life survey (self-declared obstacles).
Note: All data are for 2012, except for length of maternity leave, which is for 2013.
3.1.2. Formal education The share exceeded 20 % in Malta and In tertiary education, Italy, Romania,
Spain, although this has decreased over Croatia, Malta, Czech Republic and
49
Completion of upper secondary education the last three years ( ). The reduction Slovakia remain far below the head -
is considered to be the minimum skills in the number of early school leavers line target, although all are improving
requirement for actively participating in over the last few years can be partially (Chart 10) ( ).
50
social and economic life ( ). In 2013, 5.5 explained by counter-cyclical education
47
million people left school without finishing participation. Young people may prefer Educational mobility has, on average,
upper secondary education in the EU-28 to stay in education given the limited job improved across the EU, but having low
with the share of early leavers being over possibilities in recession or slow-grow- qualified parents still has a negative
48
15 % in Romania and Italy (Chart 9) ( ). ing economies. impact on the educational opportunities
of their children (Chart 11). The share of
( ) The FP7 research project ‘RESL.eu’ (Reducing tertiary educated young people from low
49
Early School Leaving in Europe) is collecting educated families is lowest in Austria,
data on youngsters, families and schools Italy, Poland and Slovakia, while it is the
in nine EU countries. It aims at identifying
characteristics of youth at risk of ESL as well highest in Finland. Moreover, Slovakia
as protective factors (such as social support
( ) OECD (2012b). mechanisms, resiliency and agency of pupils, ( ) The Europe 2020 headline target is that
47
etc.) which may encourage potential ESL
50
( ) Early school leaving is one of the Europe 2020 pupils to gain qualifications via alternative the share of 30–34 year olds with tertiary
48
headline targets and it aims to reduce the share learning arenas. https://www.uantwerpen.be/ education attainment or equivalent should
of early school leavers to less than 10 %. en/projects/resl-eu/ be at least 40 %.
112