Page 115 - ePaper
P. 115
Chapter 2: Investing in human capital and responding to long-term societal challenges
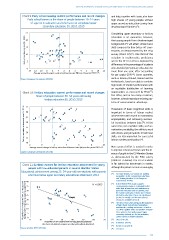
Chart 9: Early school leaving: current performance and recent changes and Italy, together with Spain, also have
Early school leavers is the share of people between 18–24 years high shares of young people without
of age not in education and who have not completed upper upper secondary education coming from
secondary education, EU, 2010, 2013 disadvantaged families ( ).
51
25 ES MT Completing upper secondary or tertiary
Early school leaving rate (%) 2013 15 PT CY DK EL IE LV UK FR EU EE IT FI BG NL BE RO SE HU SK backgrounds ( ) will attain similar basic
education is no guarantee, however,
20
that young people from disadvantaged
52
skills compared to their better-off coun-
terparts, as demonstrated by the PISA
survey (Chart 12) ( ). One third of the
53
10
DE
variation in mathematics proficiency
differences in the percentage of students
who attended pre-primary education for
0 5 SI LT LU AT HR PL CZ HR across the OECD in PISA is explained by
-14 -12 -10 -8 -6 -4 -2 0 2 4 6 8 10 12 more than one year, after accounting
Average annual change in early school leaving rate (%) over the period 2010-13
for per capita GDP ( ). Some countries,
54
Source: European Commission (2014d). such as Estonia, Finland, Ireland and the
Netherlands, have been able to combine
high levels of student performance with
an equitable distribution of learning
55
Chart 10: Tertiary education: current performance and recent changes opportunities as measured by PISA ( ).
Share of people between 30–34 years old having Too often, and in too many countries,
tertiary education EU, 2010, 2013 however, schools reproduce existing pat -
terns of socioeconomic advantage.
Tertiary education attainment rate (%) 2013 45 BE FI ES FR NL DK EU EE UK DE SI PL PT LV EL HU achievement with regard to maintaining
55
LU
Possession of basic (cognitive) skills is
LT
IE
50
important in terms of labour market
CY
SE
employability and achieving success-
40
ful transitions between jobs ( ). At the
56
same time, non-cognitive skills, such as:
35
motivation; sociability; the ability to work
30
with others; and job-specific or technical
25
57
labour market participation ( ).
20 HR BG IT AT SK RO MT CZ skills; are also important for successful
-2 0 2 4 6 8 10
Average annual change in tertiary education attainment rate (%) over the period 2010-13 More general effort is needed in order
to improve school outcomes and the lit-
Source: European Commission (2014d).
eracy of pupils in the EU Member States
as demonstrated by the PISA survey
(Table A.1 in Annex). The EU as a whole
Chart 11: Limited chances for tertiary education attainment for young is far behind its benchmark in maths,
people with low-educated parents in several Member States although the picture is more encouraging
Educational achievement among 25–34 year-old non-students with parents 51
who have below upper secondary educational attainment, 2012 ( ) For more details, see section on Tackling
inequalities in the Commission Education
and Training Monitor 2014 (European
Commission 2014d).
40 FI IE NL R² = 0.3953 ( ) In the OECD’s PISA study, a pupil’s
Proportion of non-students from low educational background with tertiary educational attainment 25 BE (FL) SE FR DK UK (Eng/N.Ir.) ES ( ) the number and type of home possessions
52
socioeconomic status is estimated by the
35
index that is based on such indicators as
30
parental education and occupation, and
related to education. These are considered
proxies for wealth and the educational
resources available at home.
20
53
EE
The OECD PISA survey compares the outcomes
15
PL
of high school students internationally in
mathematics, reading and science, as well as
10
so called cognitive skills, and provides valuable
information on how well prepared upper
5
secondary students are for the workplace,
career training or higher education.
0
0 10 20 30 AT 40 IT 50 SK 60 70 ( ) OECD (2013b).
54
Proportion of non-student from low educational background 55
who have not attained an upper secondary educational attainment ( ) Schleicher (2014).
( ) Berton et al. (2014).
56
Source of data: OECD (2014b). ( ) See Box 1.
57
113