Page 112 - ePaper
P. 112
Employment and Social Developments in Europe 2014
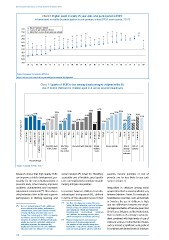
Chart 6: Higher score in math 15 year-olds who participated in ECEC
Achievement in maths by participation in pre-primary school (PISA score points, 2012)
550 No pre-primary school
1 year of pre-primary school
530 More than 1 year of pre-primary school
510
490
470
450
430
410
390
370
350
SK EL BG RO FR CY IT CZ ES SE UK DK AT BE LU HR LT PT DE PL FI NL SI LV IE EE HU
Source: European Commission (2013c).
Note: Data are not corrected for parental/socioeconomic background.
Chart 7: Uptake of ECEC is low among disadvantaged children in the EU
Use of formal childcare for children aged 0–2 across several breakdowns
42 %
36 % 36 % 39 % 35 % 38 %
32 % 32 % 31 % 30 %
27 % 30 % 29 % 27 %
22 % 10 % 19 % 24 % 14 % 21 % 14 % 18 % 18 % 13 % 15 % 21 % 16 % 16 %
% of children aged 0-2 Single parent 2 adults, 1 child 2 adults, 2 children Other with children Low Medium High Low Medium High Very low Low Medium High Very high Not employed Employed Poorest 2 3 4 Richest At risk Not at risk At risk Not at risk
2 adults, 3 children or more
Income quintile
Household work intensity
Mother
Risk of
Education
Education level
level of
of the father
poverty
working
poverty
or social
status
the mother
exclusion Risk of All
Household type
Source: Eurostat, EU-SILC 2012.
Research shows that high quality ECEC social inclusion ( ) (Chart 6). Therefore, parents, income quintiles or risk of
41
can improve a child’s development, par- accessible and affordable, good quality poverty, are far less likely to use such
ticularly for the most disadvantaged: it ECEC can significantly contribute towards services (Chart 7).
prevents early school leaving; improves helping mitigate inequalities .
academic achievement and increases Inequalities in childcare among social
educational attainment ( ). This reduces In practice, however, children from dis- groups (described as social gradients) vary
40
42
risky behaviour later in life and supports advantaged backgrounds ( ), defined between Member States. For example, in
participation in lifelong learning and in terms of the education level of their Scandinavian countries, such as Denmark
or Sweden, the use of childcare is high,
41
( ) See Box 1 for literature review. The term
( ) The FP7 research project ‘CARE’ addresses ‘early childhood education and care’ includes and the differences between the disad -
40
issues related to the quality, inclusiveness, formal services for children between birth vantaged and better-off are low (see Chart
and individual, social and economic benefits and compulsory school age focused on 8). In France, Belgium and the Netherlands,
of early childhood education and care in providing early — or pre-school — education
Europe. The central goal of CARE is to develop and childcare for working parents (Moss, there is evidence of a stronger social gra-
an evidence-based and culture-sensitive 2009 in European Commission (2013a)). dient combined with high levels of use of
European framework of developmental goals, ( ) Migrant background is one important
42
quality assessment, curriculum approaches dimension of disadvantaged people. childcare services. In other Member States,
and policy measures for improving the The analysis of this specific group goes such as Ireland, a significant social gradient
quality and effectiveness of early childhood beyond the scope of this chapter. Specific
education and care. http://ecec-care.org/ work on social gradients will deal with this. is combined with limited levels of childcare.
110