Page 108 - ePaper
P. 108
Employment and Social Developments in Europe 2014
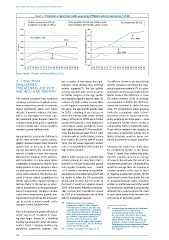
Chart 2: Potential employment path assuming different activity scenarios, EU-28
Working-age population (20-64) Active population (20-64), low activity scenario Past employment (20-64)
Employment at growth at 1 % p.a. Active population (20-64), high activity scenario
306 90
286 85
“EU-2020”: +1% 2032: 88%
266 2032 80
Millions 246 % of Working Age Population (20-64 years) 75
226 70 2021: 76%
206 2021 65
186 60
2000 2002 2004 2006 2008 2010 2012 2014 2016 2018 2020 2022 2024 2026 2028 2030 2032 2034 2036 2038 2040 2000 2002 2004 2006 2008 2010 2012 2014 2016 2018 2020 2022 2024 2026 2028 2030 2032 2034 2036 2038 2040
Source: Update of Peschner and Fotakis (2013), p. 13–15.
2. Long-term two scenarios of how labour force par- The difference between the low and high
challenges ticipation could develop (low and high activity scenarios constitutes the theo-
threatening job-rich activity scenario) ( 28 ). The low activity retical maximum potential ( ) of activa-
30
and inclusive growth scenario (dashed dark curve) assumes tion policies to encourage people into the
no further progress in the age, gender labour market. The difference is some
This section considers how workforce and education-specific activity rates. By 35 million workers (13 % of working-
shrinkage and increased global compe- contrast, the high activity scenario (blue age population in 2040). This difference
tition increase the pressure to generate curve) suggests a quantum leap: no gen- shows the potential to defer the time
higher productivity gains over future der gap in the age-specific activity rates when EU employment stops growing.
decades. It provides evidence that there by 2030; a doubling of past success in Under the assumptions made, activat-
will be no alternative to human capi- terms of increasing older-worker activity ing labour resources would extend the
tal investment given Europe’s need for rates (+20 % pts. by 2030) and a further policy window by ten more years — time
stronger productivity gains to generate gradual shift towards a more highly edu- to implement further reforms aimed at
economic growth rates strong enough to cated labour supply (activity increases safeguarding higher productivity gains.
maintain current welfare levels. with higher education) ( ). The result indi - Those will be needed in the decades to
29
cates the theoretical upper limit of what come when employment growth, due to
Ageing imposes a particular challenge to activation policies might achieve: starting higher activation, would no longer con-
the EU. After decades in which a demo- from today’s EU activity rate of around tribute to potential economic expansion.
graphic dividend helped feed economic 76 %, the EU would approach activity
growth with an increase in the work- rates of around 88 % by 2032 under the Obviously this would have implications
ing age population, the situation from high activity scenario. for productivity growth in the future.
now on is liable to move into reverse. Chart 3 shows that, before the crisis,
Moreover, the shrinkage of the workforce With no further progress in activation (low the EU’s economy grew by an average
will materialise at a time when global activity scenario), it is clear, from Chart 2, of around 2 % each year: the sum of 1 %
competition is expected to require more that the EU will see employment growth employment growth and 1 % productivity
skilled workers in many industries which turn negative relatively soon — around growth on average. Were the economy to
are under pressure to become more inno- 2021. However, even using very optimistic continue growing at this pace in times
vative and productive. The obvious out- assumptions, EU employment growth will of negative employment growth, the EU
come is fiercer global competition for be unable to follow the 1 % sustainable would have to more than double the rate
talents with human capital becoming a growth path for more than ten years. At of annual productivity gains. Activation
decisive factor in the success or other- the latest, it would turn negative around policies, no matter how successful, would
wise of businesses in an increasingly glo - 2032. In this purely theoretical ‘best pos- not remove the challenge to productivity,
balised environment. Workforce decline sible’ scenario, the EU would have arrived although they could postpone the point
could reduce employment growth, leav- by 2032 at an employment rate of 88 % in time when productivity becomes the
ing productivity growth as the only lever - with no unemployed reserve. only source of economic growth.
age to sustain economic growth and to ( ) Analysis assumes that an annual
28
maintain current welfare levels. employment growth of 1 % is achieved
from now on for as long as possible. Such ( ) Breaking down this potential by educational
30
Potential employment growth will depend a growth rate in employment is equivalent attainment level, it is obvious that
to the long-term trend prior to the crisis in
low-qualified people would contribute
on the success of EU policies in ensur- 2008, and is also consistent with meeting the most to this potential as their activity
the ‘EU2020’ employment objective for
ing that larger shares of a shrinking the EU by 2020. Starting with a 68 % rate today is way below the average
(2013: 64 % vs. 76 % in EU-28 for the age
working-age population enter the labour employment rate for people aged between group 20–64 years). Source: Eurostat LFS
20 and 64 years in 2013, the rate would be
market. Chart 2 displays working age no less than 75 % in 2020. (http://epp.eurostat.ec.europa.eu/portal/page/
portal/statistics/search_database, table
population projections together with ( ) Peschner and Fotakis (2013), pp. 10–12. lfsa_argaed).
29
106