Page 121 - ePaper
P. 121
Chapter 2: Investing in human capital and responding to long-term societal challenges
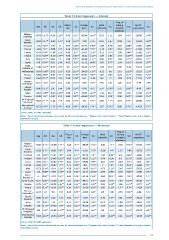
Table 3: Linear regression — Literacy
Freq. of
Educa- Foreign Work solving No ICT-
Age S.E. Sex S.E. S.E. S.E. S.E. S.E. S.E.
tion born intensity complex experience
problems
Belgium
(Flanders) -0.79 0.12** -4.35 1.35** 4.99 0.27** -35.48 3.69** 0.75 1.15 1.64 0.6** -20.06 2.04**
Czech
Republic -0.59 0.17** -3.69 1.75* 4.16 0.34** -7.29 5.91 0.01 1.67 0.98 0.8 -10.53 2.58**
Denmark -1.01 0.07** -1.54 1.1 4.03 0.18** -37.43 2.46** 1.58 0.79* 2.97 0.58** -15.87 1.88**
Finland -1.04 0.1** -0.38 1.67 4.16 0.26** -41.49 5.35** -1.12 0.87 3.12 0.67** -15.83 2.63**
France -0.59 0.08** -1.48 1.16 4.99 0.2** -25.01 2.24** -0.11 0.74 1.98 0.46** -15.82 1.6**
Ireland -0.41 0.09** -5.29 1.44** 4.83 0.31** -13.21 2.11** 1.28 0.83 1.79 0.59** -10.03 2.21**
Italy -0.56 0.13** 2.62 2.1 3.98 0.33** -23.46 4.11** 2.34 0.95* 1.66 0.79* -18.55 2.5**
Japan -0.8 0.08** 0.91 1.48 4.05 0.2** -31.12 14.06* 1.65 0.77* 1.34 0.61* -10.38 1.87**
Korea, 1.39* 0.21** -44.45 6.79** 0.63* 0.48 1.82**
Republic of -1.06 0.07** -2.87 3.6 1.49 0.38 -10.13
Netherlands -0.94 0.08** -3.02 1.32* 4.25 0.24** -34.09 3.14** -0.12 0.8 2.61 0.59** -20.26 2.23**
Norway -0.83 0.09** -3.97 1.35** 4.35 0.19** -37.05 2.58** 1.87 0.97 3.23 0.7** -19.61 2.26**
Poland -0.64 0.13** 0.28 1.86 4.36 0.28** 6.3 13.86 1.62 1.2 1.39 0.79 -12.35 2.29**
Russian
Federation * -0.25 0.19 2.54 2.03 2.35 0.51** -3.16 8.54 3.42 1.81 1.26 0.99 -1.46 3.48
Slovak
Republic -0.86 0.12** 2.6 1.44 2.69 0.28** -0.42 4.72 5.37 0.99** 3.32 0.58** -6.46 1.86**
Spain -0.64 0.08** -8.09 1.63** 4.06 0.2** -20.37 2.63** -1.41 0.67* 1.33 0.56* -14.99 1.87**
Sweden -0.99 0.1** -2.97 1.52 4.85 0.23** -40.46 2.24** 2.54 1.09* 3.05 0.62** -15.26 2.34**
UK (England/ 1.59 0.19** 3.76** 1.19 0.72** 2.45**
N.Ireland) -0.32 0.12** -1.24 2.92 -24 2.06 2.74 -20.96
International 0.07** -24.25 1.54** 0.26** 0.16** 0.55**
average -0.73 0.03** -1.76 0.38** 4.03 1.37 2.05 -14.03
Sources: PIAAC, DG EMPL elaboration.
Notes: * Data for the Russian Federation do not cover the Moscow municipal area. ** Belgium refers only to Flanders. *** United Kingdom refers only to England
and Northern Ireland.
Table 4: Linear regression — Numeracy
Freq. of
solving
Work
No ICT-
Age S.E. Sex S.E. Educa- S.E. Foreign S.E. intensity S.E. complex S.E. experience S.E.
born
tion
problems
Belgium
(Flanders) -0.66 0.13** -15.89 1.71** 5.44 0.3** -33.69 3.54** 1.36 1.17 2.23 0.66** -21.55 2.07**
Czech
Republic -0.39 0.15** -9.02 2.03** 5.04 0.4** -10.9 6.07 -0.56 1.41 1.57 0.88 -13.76 2.77**
Denmark -0.7 0.08** -12.61 1.47** 4.49 0.22** -35.73 2.8** 2.34 0.89** 3.16 0.66** -16.08 2.09**
Finland -0.85 0.1** -14.43 1.62** 4.69 0.3** -40.22 5.22** -0.74 0.96 3.5 0.79** -15.58 2.73**
France -0.55 0.1** -12.02 1.46** 6.41 0.23** -29.94 2.99** 1.41 0.94 2.23 0.5** -21.4 1.61**
Ireland -0.39 0.1** -16.07 1.5** 5.11 0.34** -8.4 2.37** 2 1.01* 1.54 0.67* -16.98 2.51**
Italy -0.72 0.14** -5.14 2.18* 4.26 0.35** -14.63 4.57** 4.72 1.13** 2.49 0.88** -23.23 2.83**
Japan -0.4 0.08** -6.68 1.79** 4.43 0.22** -32.17 15.85* 2.09 0.96* 2.35 0.66** -15.96 1.75**
Korea,
Republic of -1 0.08** -5.73 1.41** 4.41 0.24** -42.15 6.64** 1.94 0.69** 0.29 0.55 -10.55 2.1**
Netherlands -0.72 0.08** -14.33 1.34** 4.3 0.24** -36.71 3.32** 0.03 0.85 2.73 0.67** -20.39 2.6**
Norway -0.75 0.1** -15.08 1.42** 5.26 0.21** -43.97 2.99** 3.59 1.04** 2.56 0.75** -17.77 2.6**
Poland -0.52 0.14** -8.49 1.67** 4.34 0.31** -34.59 15.97* 2.56 1.29* 1.74 0.74* -14.01 2.25**
Russian
Federation * -0.23 0.2 0.6 2.36 2.55 0.58** -10.56 4.45* 2.3 1.98 2.55 0.96** -4.48 3.12
Slovak 1.74 0.3** 5.11 1.28** 0.69** 1.94**
Republic -0.85 0.14** 0.16 3.62 -3.35 6.79 3.81 -10.24
Spain -0.7 0.09** -15 1.7** 4.11 0.21** -18.16 2.89** 0.13 0.76 1.89 0.63** -19.02 1.78**
Sweden -0.8 0.11** -14.38 1.4** 5.61 0.22** -43.26 2.5** 2.83 1.15* 2.83 0.75** -13.49 2.39**
UK (England/ -0.3 0.12* -11.65 1.79** 3.25 0.22** -30.05 3.64** 2.5 1.33 3.44 0.79** -23.43 2.61**
N.Ireland)
International -0.62 0.03** -10.34 0.41** 4.55 0.07** -27.56 1.63** 2.08 0.28** 2.41 0.18** -16.35 0.58**
average
Sources: PIAAC, DG EMPL elaboration.
Notes: * Data for the Russian Federation do not cover the Moscow municipal area. ** Belgium refers only to Flanders. *** United Kingdom refers only to England
and Northern Ireland.
119