Page 123 - ePaper
P. 123
Chapter 2: Investing in human capital and responding to long-term societal challenges
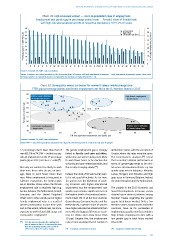
Chart 19: High educated women — more in population, less in employment
Employment rate gender gap in percentage points (male — female); share of female/male
with high educational attainment (% of respective population), 2013, 25–64 years
50 Female (rhs) 45
45
40
Male (rhs)
Percentage points (males-females) 35 30 % of total male/female population
ER gender gap (lhs)
40
35
30
25
25
20
20
15
15
10
5
0
0 5 10
FI EE IE SE LT CY UK DK LU BE LV ES FR SI NL BG PL EU-28 EL DE HU PT SK CZ HR AT MT IT RO
Sources: Eurostat, DG EMPL, own calculations.
Notes: *Countries are ranked according to the decreasing share of women with high educational attainment. ** High educational attainments means short-cycle
tertiary, bachelor or equivalent, master or equivalent and doctoral or equivalent (levels 5–8).
Chart 20: Some policy mixes are better for women’s labour market integration
FTER gap (percentage points) and female employment rate (%) in the EU Member States in 2013
80
Relative good utilisation SE High female employment
75 of female labour force - shorter hours
FI EE DK UK AT DE NL
LT
70
Female employment rate 65 BG PT SI CY HU FR SK ES IE RO PL BE CZ LU
LV
60
55
MT
50
45 Low female employment HR IT Relative worse utilisation
- longer hours EL of female labour force
40
0 5 10 15 20 25 30 35 40
Full-time equivalent employment rate gender gap
Sources: Eurostat, DG EMPL, own calculations.
Note: FTER — full-time equivalents calculated with regard to the working time of a full-time, full-year employee.
12 percentage points lower than that of The gender employment gap is strongly all Member States, with the exception of
men (62.5 % vs 74.2 %) — yet this is a sig - linked to family and care activities, Croatia, where the rates were the same.
nificant improvement on the 17 percentage with prime age women being most likely The Commission’s analyses ( ) reveal
96
94
points gap in 2002 (58.1 % vs 75.4 %) ( ). to work fewer hours or be inactive due that a country’s relative performance in
to family and care-related activities, and terms of gender-gap tends to be simi-
95
Not only are women less likely to work this is only changing slowly ( ). lar across all educational levels: e.g. low
than men, those who do are, on aver- gender gaps exist in Bulgaria, Lithuania,
age, likely to work fewer hours than Indeed, the stock of female human capi - Latvia, Hungary and Slovakia and high
men. When employment is measured in tal is not used effectively. As for men, gaps occur in Germany, Belgium, Ireland,
full-time equivalents, the largest gaps for women too the likelihood of work- the United Kingdom and the Netherlands.
are in Member States where the female ing increases with higher educational
employment rate is relatively high (e.g. attainment, but the employment rate The analysis in the 2013 Economic and
Austria, Belgium, The Netherlands, Ireland, gender gap remains significant even at Social Developments in Europe review
Germany and the United Kingdom) the highest levels of educational attain- showed some distinct patterns among
(Chart 18). In other words, part of higher ment (Chart 19). In all but four countries Member States regarding the gender
female employment rates is a result of (Luxembourg, Germany, Austria and the gap in total hours worked. Only a few
greater participation in part-time work Netherlands), a greater share of women Member States, mainly Nordic and Baltic
and, to that extent, reflects less, not more, have higher educational attainment than countries, have so far succeeded in
exposure to work-related skill usage and men, with the biggest differences occur - implementing a policy mix that combines
strong under-employment. ring in Estonia and Latvia (more than high female employment rates with a
15 pps). Despite this, the employment low gender gap in total hours worked
( ) Over the last two decades, the employment rate of men exceeded that of women in (Chart 20).
94
rate of women in the EU-15 increased by more
than ten percentage points, from 52.8 % in
1995 to 63.7 % in 2013. [lfsa_ergan]. ( ) European Commission (2014f). ( ) European Commission (2014f).
95
96
121