Page 122 - ePaper
P. 122
Employment and Social Developments in Europe 2014
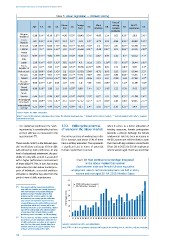
Table 5: Linear regression — Problem solving
Freq. of
Work
No ICT-
solving
Age S.E. Sex S.E. Educa- S.E. Foreign S.E. intensity S.E. complex S.E. experience S.E.
born
tion
problems
Belgium 1.67** 0.23** -18.42 3.34** 1.14 0.59** 2.41**
(Flanders) -1.28 0.14** -8.19 4.36 -0.85 1.62 -16.9
Czech 0.21** -5.15 2.37* 0.4** 6.77 2.05 0.91** 3.45**
Republic -0.9 3.17 -1.01 -2.73 4.58 -20.82
Denmark -1.48 0.07** -6.03 1.28** 3.61 0.22** -21.63 2.74** 1.6 0.76* 2.8 0.62** -15.98 2.26**
Finland -1.47 0.1** -6.23 1.35** 3.97 0.31** -15.66 4.91** -2.48 0.93** 3.01 0.66** -12.16 2.09**
France . .. . .. . .. . .. . .. . .. . ..
Ireland -0.97 0.11** -7.84 1.79** 4.35 0.34** -0.03 2.14 0.57 0.97 1.41 0.7* -10.12 2.1**
Italy . .. . .. . .. . .. . .. . .. . ..
Japan -1.58 0.14** -6.07 1.99** 3.62 0.35** 4.2 15.55 3.51 1.26** 3.3 0.91** -16.44 3.03**
Korea,
Republic of -1.61 0.1** -4.93 1.5** 2.88 0.31** -35.36 10.44** 0.95 0.81 1.41 0.64* -5.87 2.1**
Netherlands -1.12 0.08** -5.45 1.42** 3.5 0.22** -17.52 3.08** -0.71 0.85 1.92 0.6** -16.44 2.2**
Norway -1.46 0.09** -7.67 1.12** 3.84 0.22** -22.51 2.86** 1.65 0.84* 2.36 0.68** -15.35 2.1**
Poland -1.33 0.21** -12.14 2.53** 3.81 0.38** -1.57 24.06 1.11 1.87 -0.56 1.04 -17.68 2.9**
Russian
Federation * -0.88 0.24** 1.07 3.65 1.37 0.76 -1.8 4.56 5.91 2.86* 2.71 1.29* -11.98 4.92*
Slovak
Republic -0.98 0.16** -1.99 1.9 2.49 0.39** 0.89 7.44 3.17 1.45* 1.22 0.78 -9.43 2.93**
Spain . .. . .. . .. . .. . .. . .. . ..
Sweden -1.44 0.11** -5.34 1.48** 4.34 0.24** -30.23 2.29** 0.77 1.01 3.03 0.71** -11.98 2.42**
UK (England/
N.Ireland) -1.02 0.09** -7.91 1.67** 2.57 0.16** -17.17 3.15** 1.73 0.88* 1.46 0.64* -20.45 2.77**
International
average -1.25 0.04** -5.99 0.52** 3.42 0.09** -12.7 2.4** 1.01 0.37** 2.16 0.21** -14.4 0.75**
Sources: PIAAC, DG EMPL elaboration.
Notes: * Data for the Russian Federation do not cover the Moscow municipal area. ** Belgium refers only to Flanders. *** United Kingdom refers only to England
and Northern Ireland.
• The statistical significance for ‘work- 3.3.2. Utilising the potential When it comes to a better utilisation of
ing intensity’ is considerable, but less of women in the labour market existing resources, female participation
so than skill-use as measured in the becomes a concern. Although the female
92
questionnaire ( ). One in four persons of working age in the employment rate has been increasing in
EU is inactive, and about 15 % of them the EU, women are still less likely to work
These results confirm a link between peo- have a tertiary education. This represents than men with big variations across the EU
ple’s work history and usage of their skills a significant cost in terms of potential (Chart 18). In 2013, the EU-28 employment
with enhancing skills proficiency. At any human capital that is unused. rate for women aged 20–64 was more than
level of educational attainment, the pos-
sibility of using skills at work is associated
with a higher performance measurement Chart 18: Men continue to be stronger integrated
93
of those skills ( ). This, in turn, has strong in the labour market than women
implications for future labour market pros - Gaps between male and female full-time equivalent
pects of individuals. Successful workforce employment rates (FTER) and employment rate (ER) in 2013,
activation is therefore key, also from the women and men aged 20–64, 2013, Member States
point of view of skills maintenance.
35
30 FTER GAP (males-females)
92
( ) One reason could be measurement problems ER GAP (males-females)
since skill-use variables are strongly connected 25
with work-intensity so that multi-collinearity
problems emerge. Probably related to that
problem (and the reduced number of valid 20
observations), the country-specific coefficients Percentage points
vary and are not all positive. Apart from that, 15
country differences also reflect different sectoral
specialisations within each country, with more 10
knowledge-intensive sectors determining a higher
‘pay-off’ of work to skills. All in all, the evidence 5
of a positive impact of work history on skills
proficiency across all countries is still convincing.
( ) The fact that our variable considers the whole 0 LT FI LV SE BG DK PT EE SI FR HR AT DE NL ES BE CY IE UK EU-28 HU LU SK PL RO CZ EL IT MT
93
work history of the individuals, while the test
of skills proficiency are taken at one point in
time (2011 in this case), should allow for a Sources: Eurostat, DG EMPL, own calculations.
prudent inference of causal relations, from Note: FTER — full-time equivalents calculated with regard to the working time of a full-time, full-year employee.
being at work to having better skills.
120