Page 182 - ePaper
P. 182
Employment and Social Developments in Europe 2014
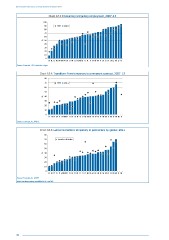
Chart A3.3: Involuntary temporary employment, 2007–13
100
90 2007 2013
80
70
60
% 50
40
30
20
10
0
AT DE EE NL HR DK MT LU SI UK SE FR EU-28 LT IE PL FI LV BG HU IT BE CZ PT SK EL RO ES CY
Source: Eurostat LFS, table lfsa_etgar.
Chart A3.4: Transitions from temporary to permanent contract, 2007–13
80
70 2007 2011
60
50
% 40
30
20
10
0
ES FR PL NL IT CY EU-28 EL FI PT LU BE SI CZ BG HU DE SK LV AT SE HR UK LT RO EE MT DK IE
Source: Eurostat, ilc_lvhl32.
Chart A3.5: Labour transitions temporary to permanent, by gender, 2011
80
70 Females Males
60
50
% 40
30
20
10
0
ES FR CY PL IT NL EU-28 EL FI LU PT BE CZ SI LT HU BG AT DE HR SE SK UK LV EE RO MT IE DK
Source: Eurostat, ilc_lvhl32
Note: No observation available for IE and DK.
180