Page 181 - ePaper
P. 181
Chapter 3: The future of work in Europe: job quality and work organisation for a smart, sustainable and inclusive growth
Annex 3: Additional indicators relating to job quality
Socioeconomic security
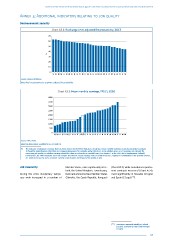
Chart A3.1: Real wage level adjusted for productivity, 2013
70
60
50
40
%
30
20
10
0
SI BE UK NL FI FR DK AT DE SE PT HR IT BG ES EE CZ MT LU HU IE CY RO EL LV PL LT SK
Source: AMECO database.
Note: Real compensation per employee adjusted for productivity.
1
Chart A3.2: Mean monthly earnings, PPS ( ), 2010
4000
3500
3000
2500
2000
1500
1000
500
0
BG RO LT SK EE HU CZ LV PL PT SI EU-27 ES IT FR CY AT SE FI NL BE DE UK LU DK IE EL MT HR
Source: SES, 2010.
Note: No observation available for EL, MT and HR.
( ) The indicator of adequate earnings that has been chosen by the EMCO Indicators Group was mean monthly earnings in purchasing power standard.
1
It should be noted however that there are ongoing discussions, for example within the OECD, as to whether gross or net earnings are relevant for
measuring job quality, or whether earnings should be taken on an hourly or monthly basis (see chapter 3 in the 2014 OECD Employment Outlook).
Furthermore, the EMCO indicator does not consider ‘increments’ to job earnings such as health insurance, employer’s contribution to the pension scheme,
etc. which increase the socio-economic security of job holders and improve the quality of jobs.
Job insecurity Member States, more significantly in Ire - (Chart A3.3), while transitions to perma-
land, the United Kingdom, Luxembourg, nent contracts worsened (Chart A3.4),
During the crisis involuntary tempo- Denmark and some New Member States most significantly in Slovakia (29 pps)
126
rary work increased in a number of (Slovakia, the Czech Republic, Hungary) and Spain (15 pps)( ).
( ) Transitions improved notably in Finland
126
(21 pps), Germany (14 pps) and Portugal
(11 pps).
179
Annex 3: Additional indicators relating to job quality
Socioeconomic security
Chart A3.1: Real wage level adjusted for productivity, 2013
70
60
50
40
%
30
20
10
0
SI BE UK NL FI FR DK AT DE SE PT HR IT BG ES EE CZ MT LU HU IE CY RO EL LV PL LT SK
Source: AMECO database.
Note: Real compensation per employee adjusted for productivity.
1
Chart A3.2: Mean monthly earnings, PPS ( ), 2010
4000
3500
3000
2500
2000
1500
1000
500
0
BG RO LT SK EE HU CZ LV PL PT SI EU-27 ES IT FR CY AT SE FI NL BE DE UK LU DK IE EL MT HR
Source: SES, 2010.
Note: No observation available for EL, MT and HR.
( ) The indicator of adequate earnings that has been chosen by the EMCO Indicators Group was mean monthly earnings in purchasing power standard.
1
It should be noted however that there are ongoing discussions, for example within the OECD, as to whether gross or net earnings are relevant for
measuring job quality, or whether earnings should be taken on an hourly or monthly basis (see chapter 3 in the 2014 OECD Employment Outlook).
Furthermore, the EMCO indicator does not consider ‘increments’ to job earnings such as health insurance, employer’s contribution to the pension scheme,
etc. which increase the socio-economic security of job holders and improve the quality of jobs.
Job insecurity Member States, more significantly in Ire - (Chart A3.3), while transitions to perma-
land, the United Kingdom, Luxembourg, nent contracts worsened (Chart A3.4),
During the crisis involuntary tempo- Denmark and some New Member States most significantly in Slovakia (29 pps)
126
rary work increased in a number of (Slovakia, the Czech Republic, Hungary) and Spain (15 pps)( ).
( ) Transitions improved notably in Finland
126
(21 pps), Germany (14 pps) and Portugal
(11 pps).
179