Page 27 - ePaper
P. 27
Job creation, productivity and more equality for sustained growth
transitions from temporary to permanent During the crisis, countries with the low- Returns to employment
contracts in 2012 – have significantly est performance did reduce the strictness are linked to the coverage
higher spending on ALMP, stronger activa - of their employment protection legisla- and adequacy of unemployment
tion conditionality, a higher participation tion, bringing some convergence of the benefits
in lifelong learning and higher coverage protection of regular employment, but
and adequacy of unemployment ben- they did not improve on the other dimen - All other things being equal, there is
efits than the countries with the low- sions that seem also to have relevance, some evidence that people receiving
est performance. see also Chapter 1 of this review. unemployment benefits have a better
chance of taking up a job than non-
recipients ( ), and that adequate and
57
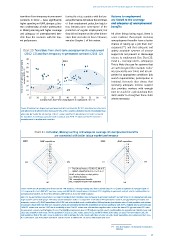
Chart 20: Transitions from short-term unemployment to employment widely available systems of income
(2012-13) and from temporary to permanent contracts (2011-12) support do not prevent or discourage
returns to employment (See Chart 22,
80 2012 EE Panel A – coverage and B – adequacy).
Transition from temporary to permanent contracts 2011-12 50 RO SK HR BG PT CY HU FI CZ LV SE SI DE UK DK AT are well designed (for example, reduc-
70
This is likely the case for systems that
MT
60
ing generosity over time) and accom-
panied by appropriate conditions (job
40
search requirements, participation in
30
training). Research also shows that
receiving adequate income support
20
10
time to search for a job matching their
0 EL ES IT PL LT FR NL also provides workers with enough
skills and/or to strengthen those skills
15 20 25 30 35 40 45 50 55 60 65 where necessary.
Transition from short-term unemployment to employment 2012-13
Source: Transitions from temporary to permanent contracts from Eurostat, EU-SILC.; transitions from short-term
unemployment to employment from Eurostat, EU LFS, ad-hoc transition calculations based on longitudinal data.
Note: Blue line marks the EU average. 2010-11 values used for CY, HR, HU, MT, PL, PT, RO, SE and SK
for transitions from temporary to permanent contracts and 2010-11 value used for NL short-term
unemployment to employment transition.
Chart 21: Activation, lifelong learning and adequate coverage of unemployment benefits
are associated with better labour market performance
2007 ALMP expenditure 2012 ALMP expenditure
2.0 2.0
1.5 1.5
1.0 1.0
0.5 0.5
0 0
-0.5 -0.5
-1.0 -1.0
LLL -1.5 EPL LLL -1.5 EPL
-2.0
-2.0
Top LM performers: AT, UK, DE, DK & SE
Bottom LM performers: EL, ES, PL & IT
ALMP: active labour market policies
LLL: lifelong learning
UB: unemployment benefits
UB EPL: employment protection legislation UB
Source: ALMP and UB spending data from Eurostat LMP database, Lifelong learning data from Eurostat (trng_lfs_02), data on opinions of managers (part of
LLL component) is from IMD WCY executive survey and IMD World Competitiveness Yearbook 2012, eligibility requirements and job-search conditionalities for
unemployment benefits are from Venn (2012) and EPL index is from the OECD database.
Note: The top and bottom LM performers are ranked according to their transitions from temporary to permanent contracts and exits from STU to employment with only
large countries used in both groups. The labour market institutions index is a composite Z-score index of EPL (permanent contracts and gap between permanent and
temporary contracts v3), ALMP (expenditure in % of GDP and activation/job search conditionalities), lifelong learning (participation rates of total population and opinions
of managers about skills from IMD WCY executive survey) and unemployment benefits (expenditure per person wanting to work in PPS, eligibility criteria and coverage).
2008 EPL values were used for 2007 due to availability of data. The EPL values were all turned into negative values so that the lowest EPL gap and lowest EPL value
for permanent contracts had the highest Z-score. The eligibility requirements (part of UB indicator) and job-search conditionalities for unemployment benefits have only
2012 data available in both years. The UB spending for 2012 uses 2011 values, expect for EL and UK for whom 2010 values are used. The mean value in 2012 for
each indicator is that of the 2007 scores in order to be able to compare the 2012 scores with those of 2007. For 2012 ALMP expenditure 2011 values used for CY, ES,
IE, LU, MT and PL, and 2010 values used for EL and UK. For EPL in 2007 for EE, LU and SI, 2008 values were used.
( ) See also Chapter 1 in European Commission
57
(2014a).
25
transitions from temporary to permanent During the crisis, countries with the low- Returns to employment
contracts in 2012 – have significantly est performance did reduce the strictness are linked to the coverage
higher spending on ALMP, stronger activa - of their employment protection legisla- and adequacy of unemployment
tion conditionality, a higher participation tion, bringing some convergence of the benefits
in lifelong learning and higher coverage protection of regular employment, but
and adequacy of unemployment ben- they did not improve on the other dimen - All other things being equal, there is
efits than the countries with the low- sions that seem also to have relevance, some evidence that people receiving
est performance. see also Chapter 1 of this review. unemployment benefits have a better
chance of taking up a job than non-
recipients ( ), and that adequate and
57
Chart 20: Transitions from short-term unemployment to employment widely available systems of income
(2012-13) and from temporary to permanent contracts (2011-12) support do not prevent or discourage
returns to employment (See Chart 22,
80 2012 EE Panel A – coverage and B – adequacy).
Transition from temporary to permanent contracts 2011-12 50 RO SK HR BG PT CY HU FI CZ LV SE SI DE UK DK AT are well designed (for example, reduc-
70
This is likely the case for systems that
MT
60
ing generosity over time) and accom-
panied by appropriate conditions (job
40
search requirements, participation in
30
training). Research also shows that
receiving adequate income support
20
10
time to search for a job matching their
0 EL ES IT PL LT FR NL also provides workers with enough
skills and/or to strengthen those skills
15 20 25 30 35 40 45 50 55 60 65 where necessary.
Transition from short-term unemployment to employment 2012-13
Source: Transitions from temporary to permanent contracts from Eurostat, EU-SILC.; transitions from short-term
unemployment to employment from Eurostat, EU LFS, ad-hoc transition calculations based on longitudinal data.
Note: Blue line marks the EU average. 2010-11 values used for CY, HR, HU, MT, PL, PT, RO, SE and SK
for transitions from temporary to permanent contracts and 2010-11 value used for NL short-term
unemployment to employment transition.
Chart 21: Activation, lifelong learning and adequate coverage of unemployment benefits
are associated with better labour market performance
2007 ALMP expenditure 2012 ALMP expenditure
2.0 2.0
1.5 1.5
1.0 1.0
0.5 0.5
0 0
-0.5 -0.5
-1.0 -1.0
LLL -1.5 EPL LLL -1.5 EPL
-2.0
-2.0
Top LM performers: AT, UK, DE, DK & SE
Bottom LM performers: EL, ES, PL & IT
ALMP: active labour market policies
LLL: lifelong learning
UB: unemployment benefits
UB EPL: employment protection legislation UB
Source: ALMP and UB spending data from Eurostat LMP database, Lifelong learning data from Eurostat (trng_lfs_02), data on opinions of managers (part of
LLL component) is from IMD WCY executive survey and IMD World Competitiveness Yearbook 2012, eligibility requirements and job-search conditionalities for
unemployment benefits are from Venn (2012) and EPL index is from the OECD database.
Note: The top and bottom LM performers are ranked according to their transitions from temporary to permanent contracts and exits from STU to employment with only
large countries used in both groups. The labour market institutions index is a composite Z-score index of EPL (permanent contracts and gap between permanent and
temporary contracts v3), ALMP (expenditure in % of GDP and activation/job search conditionalities), lifelong learning (participation rates of total population and opinions
of managers about skills from IMD WCY executive survey) and unemployment benefits (expenditure per person wanting to work in PPS, eligibility criteria and coverage).
2008 EPL values were used for 2007 due to availability of data. The EPL values were all turned into negative values so that the lowest EPL gap and lowest EPL value
for permanent contracts had the highest Z-score. The eligibility requirements (part of UB indicator) and job-search conditionalities for unemployment benefits have only
2012 data available in both years. The UB spending for 2012 uses 2011 values, expect for EL and UK for whom 2010 values are used. The mean value in 2012 for
each indicator is that of the 2007 scores in order to be able to compare the 2012 scores with those of 2007. For 2012 ALMP expenditure 2011 values used for CY, ES,
IE, LU, MT and PL, and 2010 values used for EL and UK. For EPL in 2007 for EE, LU and SI, 2008 values were used.
( ) See also Chapter 1 in European Commission
57
(2014a).
25