Page 26 - ePaper
P. 26
Employment and Social Developments in Europe 2014
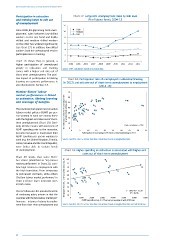
Participation in education Chart 17: Long-term unemployment rates by skill level
and training helps to exit out (% of labour force), 2004-13
of unemployment
12
High
Since 2008, the gap in long-term unem- 10 Medium
ployment rates between low-skilled Low
workers on the one hand and highly 8
skilled and medium-skilled workers
on the other has widened significantly 6
(see Chart 17). In addition, low-skilled
workers (and the unemployed) tend to 4
participate less in training. 2
Chart 18 shows that, in general, a 0
higher participation of unemployed 2004 2005 2006 2007 2008 2009 2010 2011 2012 2013
people in education and training
Source: EMPL calculations based on Eurostat data.
comes with a higher exit rate out of
short-term unemployment. The posi-
tive impact of participation in lifelong Chart 18: Participation rate of unemployed in education/training
learning on economic performance is (in 2012) and exit rate out of short-term unemployment to employment
also illustrated in Section 4.3. (2012-13)
Member States’ labour 70
market performance is linked
to activation, lifelong learning 60 EE UK AT
and coverage of benefits 50 CZ DE LV NL DK SE
The countries that spend most on active 40 HU FR CY MT SI PT FI
labour market policies (ALMP) per per- Exit rate out of short-term unemployment, to employment (2012-13) 30 LT BG IE
son wanting to work are among those HR PL IT ES
with the highest exit rates out of short- 20 SK RO
term unemployment (Chart 19). Simi- 10 EL
larly, Member States with low levels of Coef correlation = 0.58
ALMP spending prior to the recession, 0 0 5 10 15 20 25 30 35 40 45
but who increased or maintained their Participation of unemployed (25-64) to education/training in 2012
ALMP spending per person wanting to
work (e.g. the United Kingdom, Estonia, Source: Eurostat, EU-LFS, ad-hoc transition calculations based on longitudinal data.
Latvia, Slovakia and the Czech Republic),
were better able to contain levels
of unemployment. Chart 19: Higher spending on activation is associated with higher exit
rates out of short-term unemployment
Chart 20 shows that some Mem-
ber States (identified as ‘top labour 60 AT
market performers’ in Chart 21) com- 55
bine high returns to employment with 50 EE CZ CY DE NL
the high transitions from temporary 45 SI SE
to permanent contracts, while others 40 LV UK FI FR
(‘bottom labour market performers’ in Transitions from STU to employment 2010-11, % 35 HU PT
Chart 21) have lower transition rates LT PL ES
in both cases. 30 RO SK IE
25
Chart 21 illustrates the potential benefits 20 y = 0.0026x + 35.39
of combining policy actions in that the 15 EL R² = 0.246
countries with the best labour market per - 0 1 000 2 000 3 000 4 000 5 000 6 000 7 000
formance – in terms of returns to employ - ALMP expenditure (cat. 1.1-7) per person wanting to work 2010, pps
ment from short-term unemployment and Source: Eurostat, EU-LFS, ad-hoc transition calculations based on longitudinal data and LMP database.
24