Page 23 - ePaper
P. 23
Job creation, productivity and more equality for sustained growth
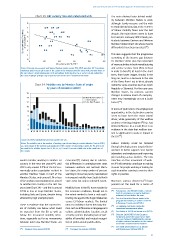
Chart 13: Job vacancy rate and undeclared work The main driving factor behind mobil-
ity between Member States is work,
8 although family reasons and the wish
7 6 RO BG SK LT EL HU to study abroad also play a role. In terms
of labour mobility flows over the last
Survey estimate of incidence of UDW 2013, % 5 4 3 PT PL LU SI CZ ES EE NL BE been income and wage differentials, par -
decade, the main drivers seem to have
ticularly between Eastern and Western
Member States (Chart 14) where income
46
differentials have been greatest ( ).
1 2 IE CY SE UK AT FI DE This also suggests that the progressive
narrowing of the income gap between
0
0 0.5 1.0 1.5 2.0 2.5 EU Member States plus the movement
Job vacancy rate, %, 2012 of many activities in both manufacturing
Source: Eurostat, jvs_q_nace2 and Special Eurobarometer survey 402, 2013, question 10: ‘Sometimes and service sectors from West to East
employers prefer to pay all or part of the salary or the remuneration (for extra work, overtime hours or in order to benefit, at least in the short
the part above a legal minimum) in cash and without declaring it to tax or social security authorities.
Has your employer paid you any of your income in the last 12 months in this way?‘ term, from lower wages, should, in the
long run, lead to a decrease in the size
of the flows from East to West, already
Chart 14: Mobility rate by Member State of origin visible for some countries (such as Czech
by years of residence (2013) Republic or Slovenia). For the euro-area
Member States, by contrast, current
16
changes in relative levels of unemploy-
14 More than 10 years ment may increasingly act as a ‘push
5 to 10 years
47
12 Less than 5 years factor’ ( ).
10
In terms of ‘pull factors’, the employment
8 opportunities in the destination country
6 seem to have been the most crucial
4 driver, while generosity of the welfare
48
systems or the legal regime ( ) has had
2 limited influence. As a result, there is no
0 evidence in the data that welfare tour-
LV LT RO CY BG LU PL EE SK HU PT IE EL NL AT HR BE CZ DK IT FI ES FR SE DE UK
ism is significant in scale or impact in
49
the EU ( ).
Source: DG EMPL calculations based on Eurostat EU-LFS.
Notes: The mobility rate is the number of working-age citizens living in another Member State in 2013, Labour mobility could be fostered
as a percentage of the working-age population of the country of citizenship. Figures for MT and SI are through developing more targeted inter -
too small to be reliable. Figures for CY, DK, EE, FI, LU and SE are not reliable due to the small size of
the sample. ventions to better support cross-border
jobseekers and employers and improving
job matching across borders. The new
45
would consider working in another EU concerned ( ). Indeed, due to substan- Directive on free movement of work-
country in the next ten years ( ), until tial differences in unemployment rates ers ( ) will certainly contribute to making
50
44
2013 only around 3.3 % of the EU eco- between southern and northern Mem- it easier for people working or looking for
nomically active population resided in ber States, the rising number of persons a job in another country to exercise their
another Member State. In half of the wanting to move has partly materialised rights in practice.
Member States, only around 1 % or less in increased mobility from South to North
51
of the working-age population has moved since 2011 but only to a limited extent. Moreover, various observers ( ) have
to another EU country in the last ten pointed out the need for a series of
years (see Chart 14) – and this is around Mobility flows in the EU have reacted to
46
0.5 % or less in large Member States, the economic conditions, though not to ( ) Among euro-area Member States, a certain
including Italy and Spain, despite being the extent needed to have a real equili- level of convergence in income had been
achieved, at least before the crisis.
affected by high unemployment. brating role against the huge imbalances ( ) See also the article ‘Recent trends in the
47
across EU labour markets. The limited geographical mobility of workers in the EU’
in European Commission (2014b).
There is evidence that the current lev- intra-EU mobility is due to the many bar - ( ) i.e.: applying restrictions during the
48
els of mobility are below what could riers such as differences in language and transitional arrangements phase.
be expected from the EU as well as culture, administration, taxation, social ( ) See Guild et al. (2013) and Juravle et al. (2013).
49
50
below the measured mobility inten security systems (including lack of port- ( ) Directive 2014/54/EU of the European
-
Parliament and of the Council of 16 April
tions, especially as far as movements ability of benefits) and mutual recogni- 2014 on measures facilitating the exercise
between euro-area Member States are tion of professional qualifications. of rights conferred on workers in the context
of freedom of movement for workers.
51
( ) See OECD (2014), Dhéret et al. (2013)
44
( ) European Commission (2013f). ( ) European Commission (2013d). and Bertelsmann Stiftung (2014).
45
21