Page 18 - ePaper
P. 18
Employment and Social Developments in Europe 2014
8
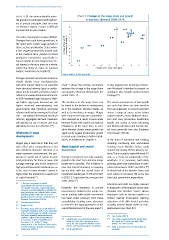
2020-23 ( ). The sober outlook for poten - Chart 7: Changes in the wage share and growth
tial growth (in combination with high lev - in domestic demand, 2008-13, %
els of private and public debt for many
EU Member States) creates a difficult 2
environment for job creation. 1 SE LU DE
0 AT BE FI
The policy environment remains difficult. -1 DK UK FR NL
Changes that could boost growth are, in -2 IT
the short term, faster wage growth in Average annual growth in domestic demand, % -3 ES PT
those sectors and Member States where -4 IE
it has lagged productivity growth and, -5
in the medium term, policies to boost -6
productive investment, specifically in -7
human capital. A more expansionary fis - EL
cal stance in the euro area as a whole, -8 -6 -5 -4 -3 -2 -1 0 1 2 3 4
within the limits of rules on national Change in the wage share (pps)
9
budgets would also be helpful ( ).
Source: AMECO, ALCD0 and OUNT.
Stronger demand and structural reforms
should ideally occur simultaneously,
with little impact likely to be expected Chart 7 shows the positive correlation It also explains the incoming Commis-
from structural reforms (such as institu- between the change in the wage share sion President’s intention to present an
tional, product market and labour market and growth in domestic demand over the ambitious Jobs, Growth and Investment
reforms) in a weak demand environment. period 2008-13. Package ( ).
14
As ECB President Draghi has put it: ‘With-
out higher aggregate demand, we risk The weakness in the wage share can The social consequences of low growth
higher structural unemployment, and be linked to the decline in employment, are such that there are clear benefits
governments that introduce structural as in the Southern Member States, as from an expansion in social investment
reforms could end up running just to stand well as to weakness in wages. Wages across a range of areas: active labour
still. … But without determined structural were compressed and price competitive- market policies; early childhood educa-
reforms, aggregate demand measures ness restored as a result in (euro-area) tion and care; preventive healthcare;
will quickly run out of steam and may Member States with significant external health and safety at work; retraining
ultimately become less effective.’ ( ) imbalances. At the same time, in some and lifelong education; and human capi-
10
other Member States, wage growth has tal more generally (see also European
Weakness in wage significantly lagged productivity growth Commission, 2013b).
developments in recent years, pointing to further imbal -
ances, as evidenced in Chapter 4. In the area of education and training,
Wages play a dual role in that they not including continuing and work-based
only affect price competitiveness, but Weak (capital and social) learning, many Member States could
also influence domestic demand. In a investment improve the quality of their delivery sys-
weak economic environment, the pro- tems. This is crucial to raise skill levels ( )
15
pensity to spend out of labour income Stronger investment not only supports and, as a result, the productivity of the
(and particularly for those at lower and growth in the short-term but also brings workforce. It is, moreover, particularly
average earnings and in the context of longer-term benefits. The evidence is pressing, given that expenditure on edu-
high private/household indebtedness as now that the EU economy is investing cation fell between 2007 and 2011 ( )
16
is the case in many Member States) is far too little, with the overall share of in almost half of the Member States and
higher than the propensity to spend out investment standing at 17.3 % of EU GDP even where it increased, did so by less
11
of capital income ( ). in 2013, 2.7 pps below the average from than total government expenditure.
12
1995-2002 ( ).
( ) ‘… the pre-crisis boost to capital Education and skills are highly relevant
8
accumulation did not lead to increased
TFP growth. Post crisis, capital and labour Evidently, the weakness in private to employers, with employer survey data
resources are only gradually re-allocated to investment is linked to the weak eco- showing that Member States whose
more productive uses, which further strains
potential growth.’ From ‘The euro area’s nomic outlook, while public investment employers look at human capital in a
growth prospects over the coming decade’ in has been under pressure from fiscal holistic manner (motivation, training,
European Commission (2013e).
( ) See also Draghi (2014). consolidation, leading some observers education at all skills levels) and value
9
10
( ) Draghi (2014). to reassess the appropriateness of the it highly achieve higher levels of com-
13
( ) The wage share, which is compensation of overall fiscal stance for the euro area ( ). petitiveness (see Chart 32).
11
employees divided by GDP, is also equivalent
to the real unit labour cost which measures
real (price-adjusted) compensation per ( ) See Juncker (2014).
14
employee adjusted for productivity and 12 15
is a measure of price competitiveness. ( ) Similarly, the 2013 investment share is ( ) This need is suggested by the results from
See Annex 1 of Chapter 5, ‘Wage below its 1995-2002 average in seven the recent OECD Survey on Adult Skills
developments in the European Union during out of the nine largest EU Member States (PIAAC), see OECD (2013).
16
a severe economic downturn’ of European (France and Sweden being the exceptions). ( ) 2011 is the latest year for which data are
Commission (2013c). ( ) See Draghi (2014). available.
13
16
8
2020-23 ( ). The sober outlook for poten - Chart 7: Changes in the wage share and growth
tial growth (in combination with high lev - in domestic demand, 2008-13, %
els of private and public debt for many
EU Member States) creates a difficult 2
environment for job creation. 1 SE LU DE
0 AT BE FI
The policy environment remains difficult. -1 DK UK FR NL
Changes that could boost growth are, in -2 IT
the short term, faster wage growth in Average annual growth in domestic demand, % -3 ES PT
those sectors and Member States where -4 IE
it has lagged productivity growth and, -5
in the medium term, policies to boost -6
productive investment, specifically in -7
human capital. A more expansionary fis - EL
cal stance in the euro area as a whole, -8 -6 -5 -4 -3 -2 -1 0 1 2 3 4
within the limits of rules on national Change in the wage share (pps)
9
budgets would also be helpful ( ).
Source: AMECO, ALCD0 and OUNT.
Stronger demand and structural reforms
should ideally occur simultaneously,
with little impact likely to be expected Chart 7 shows the positive correlation It also explains the incoming Commis-
from structural reforms (such as institu- between the change in the wage share sion President’s intention to present an
tional, product market and labour market and growth in domestic demand over the ambitious Jobs, Growth and Investment
reforms) in a weak demand environment. period 2008-13. Package ( ).
14
As ECB President Draghi has put it: ‘With-
out higher aggregate demand, we risk The weakness in the wage share can The social consequences of low growth
higher structural unemployment, and be linked to the decline in employment, are such that there are clear benefits
governments that introduce structural as in the Southern Member States, as from an expansion in social investment
reforms could end up running just to stand well as to weakness in wages. Wages across a range of areas: active labour
still. … But without determined structural were compressed and price competitive- market policies; early childhood educa-
reforms, aggregate demand measures ness restored as a result in (euro-area) tion and care; preventive healthcare;
will quickly run out of steam and may Member States with significant external health and safety at work; retraining
ultimately become less effective.’ ( ) imbalances. At the same time, in some and lifelong education; and human capi-
10
other Member States, wage growth has tal more generally (see also European
Weakness in wage significantly lagged productivity growth Commission, 2013b).
developments in recent years, pointing to further imbal -
ances, as evidenced in Chapter 4. In the area of education and training,
Wages play a dual role in that they not including continuing and work-based
only affect price competitiveness, but Weak (capital and social) learning, many Member States could
also influence domestic demand. In a investment improve the quality of their delivery sys-
weak economic environment, the pro- tems. This is crucial to raise skill levels ( )
15
pensity to spend out of labour income Stronger investment not only supports and, as a result, the productivity of the
(and particularly for those at lower and growth in the short-term but also brings workforce. It is, moreover, particularly
average earnings and in the context of longer-term benefits. The evidence is pressing, given that expenditure on edu-
high private/household indebtedness as now that the EU economy is investing cation fell between 2007 and 2011 ( )
16
is the case in many Member States) is far too little, with the overall share of in almost half of the Member States and
higher than the propensity to spend out investment standing at 17.3 % of EU GDP even where it increased, did so by less
11
of capital income ( ). in 2013, 2.7 pps below the average from than total government expenditure.
12
1995-2002 ( ).
( ) ‘… the pre-crisis boost to capital Education and skills are highly relevant
8
accumulation did not lead to increased
TFP growth. Post crisis, capital and labour Evidently, the weakness in private to employers, with employer survey data
resources are only gradually re-allocated to investment is linked to the weak eco- showing that Member States whose
more productive uses, which further strains
potential growth.’ From ‘The euro area’s nomic outlook, while public investment employers look at human capital in a
growth prospects over the coming decade’ in has been under pressure from fiscal holistic manner (motivation, training,
European Commission (2013e).
( ) See also Draghi (2014). consolidation, leading some observers education at all skills levels) and value
9
10
( ) Draghi (2014). to reassess the appropriateness of the it highly achieve higher levels of com-
13
( ) The wage share, which is compensation of overall fiscal stance for the euro area ( ). petitiveness (see Chart 32).
11
employees divided by GDP, is also equivalent
to the real unit labour cost which measures
real (price-adjusted) compensation per ( ) See Juncker (2014).
14
employee adjusted for productivity and 12 15
is a measure of price competitiveness. ( ) Similarly, the 2013 investment share is ( ) This need is suggested by the results from
See Annex 1 of Chapter 5, ‘Wage below its 1995-2002 average in seven the recent OECD Survey on Adult Skills
developments in the European Union during out of the nine largest EU Member States (PIAAC), see OECD (2013).
16
a severe economic downturn’ of European (France and Sweden being the exceptions). ( ) 2011 is the latest year for which data are
Commission (2013c). ( ) See Draghi (2014). available.
13
16