Page 17 - ePaper
P. 17
Job creation, productivity and more equality for sustained growth
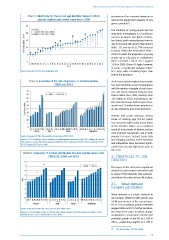
Chart 4: NEET rate for the EU, EA and Member States in 2013 persistence of an economic downturn as
and the highest and lowest rates since 2008 well as the adjustment capacity of any
7
given economy ( ).
25
2013 The situation of young people and the
20 Lowest rate since 2008 long-term unemployed is of particular
Highest rate since 2008
% of population 15-24 15 ber States, youth unemployment rates in
concern. In almost two thirds of Mem-
July 2014 were still close to their historic
highs – EU average of 21.7 % compared
10
(Chart 3) while the proportion of young
5 to about 15 % in the first half of 2008 –
people not in education or employment
0 (NEET) reached 13 % in 2011 against
LU NL DK DE AT SE CZ SI FI MT LT FR EE PL BE EA-18 EU-28 LV UK SK PT HU IE RO HR ES CY EL BG IT 11 % in 2008 (Chart 4). Again, however,
it varies considerably between Mem-
Source: Eurostat, EU-LFS data [edat_lfse_20]. ber States while remaining higher than
before the downturn.
Chart 5: Evolution of the risk-of-poverty or social exclusion, Such severe labour market deterioration
2008 and 2013 has had inevitable social consequences
with the number of people at risk of pov -
50 erty and social exclusion rising by more
45 2008 2012/2013 than 6 million since 2008, reaching some
40 123 million in 2013, and taking us fur-
35 ther from the Europe 2020 target of hav -
% of population 30 ing at least 20 million fewer people in or
at risk of poverty and social exclusion.
25
20
15 Poverty and social exclusion among
10 those of working age (18-64 years)
5 has increased significantly in two thirds
0 of the Member States as a combined
CZ FI AT SK PL RO FR DE BE NL SE SI EA-18 EE EU-28 UK PT HR LV DK LU MT ES CY IT IE LT HU EL BG result of rising levels of jobless and low
Decrease Stable Increase Strong increase
work intensity households, and in-work
Source: Eurostat, EU SILC [ilc_peps01], income year 2007, 2012. poverty. In Greece, Ireland, Spain, Italy
Notes: ES 2013 break in series (classified as strong increase based on 2008-2012 change), AT and UK and Hungary, poverty, social exclusion
2012 break in series, HR 2010 instead of 2008 and 2012 instead of 2013, IE 2012 instead of 2013, and inequalities have increased signifi-
EU-27 instead of EU-28 in 2008.
cantly from already high levels prior to
the crisis.
Chart 6: Inequality of income distribution (income quintile share ratio
S80/S20), 2008 and 2013 2. Obstacles to job
8 creation
7 2008 2013 The legacy of the crisis poses significant
6 obstacles to job creation now, which add
5 to many of the obstacles that were pre-
Ratio 4 sent before the crisis and are still in place.
3 2.1. Weak demand
2 hampers job creation
1 Weak demand is a major obstacle to
0 job creation. While EU GDP growth was
NL FI BE MT UK DE PL LV RO CZ AT FR EU-28 PT EA-18 BG SI SK SE IE LT HU DK LU CY HR EE IT ES EL 1.2 % year-on-year in the second quar-
Decrease Stable Increase Strong increase ter of 2014, potential growth estimates
Source: Eurostat, EU SILC [ilc_di11], income year 2007, 2012. suggest little room for further accelera-
Notes: ES 2013 break in series, AT and UK 2012 break in series, HR 2010 instead of 2008, IE 2012 tion from there under ‘no policy change’
instead of 2013, EU-27 instead of EU-28 in 2008. assumptions. Commission estimates put
potential growth in the EU at 1.0 % in
2015, accelerating slightly to 1.4 % in
7
( ) See also Chapter 4 of this review.
15