Page 19 - ePaper
P. 19
Job creation, productivity and more equality for sustained growth
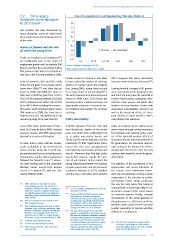
2.2. Crisis legacy Chart 8: Evolution of EU employment by firm size, 2010-13
reinforces some obstacles
to job creation 2.0
1.5
Job creation has been hampered by 1.0
many obstacles, some of which have
been reinforced by the lingering effects 0.5
of the crisis. % 0
Access to finance and the role -0.5
of small and young firms -1.0 All sectors Excl. construction
-1.5
Small- and medium-sized enterprises ( ) -2.0
17
are traditionally seen as the motor of 0-9 10-49 50-249 250+ Total SME
employment growth with, for example, EIM Source: European Commission (2013a).
Business & Policy Research (2012) finding Note: Sectors covered are Nace R.2 B-J, L,M,N.
that, between 2002 and 2010, 85 % of net
new jobs in the EU were created by SMEs.
Limited access to finance is also likely 2012, suggests that policy uncertainty
26
In the US, between 2002 and 2007, 58 % to have curbed the number of start-ups has come down in the last two years ( ).
of the net job gains in the private sector which is of concern given the evidence
18
came from SMEs ( ) and, after the job that, among SMEs, young firms account Looking forward, changes to EU govern-
23
losses in 2008 and 2009, the share of for a major share of net job growth ( ). ance, specifically in the financial sector
SMEs was 51 % of the gains from 2010 to The lack of dynamism in the employment and the fiscal area, have the potential to
2013 ( ). By contrast, between 2010 and record of SMEs since 2010 shows the further reduce policy uncertainty. Nev-
19
2013, employment in SMEs in the EU fell potential positive employment impact of ertheless, high private and public debt
by 0.5 % ( 20 ). When excluding the construc - appropriate solutions to financial sec- burdens in many Member States, with
tion sector, which employed one in seven tor problems and support for business associated sustainability concerns, as
SME workers in 2008, this turns into a start-ups. well as the uncertain effects of struc-
slight increase of 0.3 %, dwarfed by a 2 % tural reforms in some Member States,
rise among large firms (see Chart 8). Policy uncertainty may hamper this reduction.
Some of the under-performance of SMEs A further hangover from the crisis that Policy uncertainty can be addressed to
since 2010 may be due to SMEs’ reduced has blocked job creation in the recent some extent through raising awareness
access to finance, with SMEs being more past, and which risks continuing to do by European and national policy mak-
dependent on external financing. so, is policy uncertainty. Arpaia and ers of the potential positive effects of
Turrini (2013) used an indicator of policy structural reforms and improvements in
To date, and in many Member States, uncertainty ( ) that ‘significantly (influ- EU governance. On structural reforms,
24
credit availability to the non-financial ences) the euro area unemployment more clarity on the timing of its effects,
sector remains weak, due to both sup- rate indirectly, via economic activity, and usually with short-term costs but only
ply and demand factors including sector directly’. Moreover, they find that ‘policy medium-term benefits, would be gener-
restructuring and the deleveraging that uncertainty impacts mostly the pro- ally helpful.
followed the financial crisis ( ). Moreo- cess of job creation’. In this respect the
21
ver, bank lending rates in the vulnerable strong relationship between the indicator The addition of the scoreboard of key
Member States remain high despite of policy uncertainty and the Economic employment and social indicators to
22
25
-
recent ECB actions ( ), and this has Sentiment Indicator (ESI ( )), together the Europe 2020 monitoring frame
mainly affected SMEs. with the rise in the latter since autumn work has the potential to bring a better
assessment of the situation in individ-
ual Member States, which could pave
( ) SMEs, defined as those with less than the way for more policy fine-tuning at
17
250 employed persons. The official EU
definition combines this with a condition on ( ) See, for example, Haltiwanger et al. (2010) national level. It should also help in tak-
23
either the turnover or balance sheet total, and Lawless (2013). ing better account of the social impact
see http://ec.europa.eu/enterprise/policies/ ( ) Arpaia and Turrini (2013) measure policy
24
sme/facts-figures-analysis/sme-definition/ uncertainty as an index constructed of economic policies. Finally, stronger
index_en.htm from two sub-indices, one made up from involvement of the social partners in
( ) Here also defined as firms with less than counting some uncertainty-related words the policy process at EU level, and in the
18
250 employed persons. in newspaper articles, and another one
( ) Own calculations based on Bureau of Labor measuring the extent of disagreement Member States, would serve to promote
19
Statistics, Gross Job Gains and Losses, from among forecasters on some variables. a wider ‘ownership’ of policies and their
Business Employment Dynamics (BDM). Note ( ) The ESI, whose purpose is to track GDP delivery in a lasting way.
25
that there is an ongoing debate in the US growth, is calculated by the Commission on
about the role of SMEs in creating new jobs the basis of confidence indicators resulting
with papers using varying definitions of SMEs. from the Joint Harmonised EU Programme
( ) European Commission (2013a). of Business and Consumers Surveys. The 26
20
( ) See ECB (2014) and Turner (2014). correlation between the indicator of policy ( ) The ECB also found that economic policy
21
uncertainty came down but still remains
uncertainty and the ESI evidently has a
22
( ) They remain above the rates seen in the negative sign and the policy uncertainty somewhat higher than its pre-crisis average
core countries. index anticipates swings in the ESI. level, see ECB (2013), Box 4.
17