Page 24 - ePaper
P. 24
Employment and Social Developments in Europe 2014
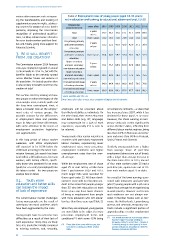
various other measures such as improv- Table 2: Employment rates of young people (aged 18-34 years)
ing the transferability and tracking of not in education and training, by educational attainment level, EU-28
supplementary pension rights, address- Educational
ing concerns for taxation of cross-border attainment level years after 2007 2008 2009 2010 2011 2012 2013
pensions, improving the cross-border 3 years
recognition of professional qualifica - Total or less 75.2 76.2 72.0 71.1 71.2 69.9 69.5
tions, tackling administrative obstacles Total Over 3 years 78.2 78.5 75.6 74.9 74.5 73.6 72.8
for cross-border workers and their fami - Pre-primary, primary
lies and, finally, giving more support for and lower secondary 3 years 53.2 52.1 43.9 42.8 42.9 37.1 38.4
language learning. education or less
Pre-primary, primary
3. Who will benefit and lower secondary Over 3 years 65.4 64.7 59.2 57.4 56.1 54.2 52.5
from job creation? education
Upper secondary
The Commission autumn 2014 forecast and post-secondary 3 years 72.1 73.4 68.9 67.9 67.3 65.6 65.1
envisages employment growth of around non-tertiary education or less
0.7 % annually in 2014-16, but with the Upper secondary
benefits liable to be unevenly spread and post-secondary Over 3 years 80.3 80.9 78.3 77.9 77.5 76.5 75.5
across Member States and sections of non-tertiary education
the population. The logical question then First and second stage 3 years
is who is likely to benefit most from the of tertiary education or less 84.0 84.4 80.9 80.0 80.3 79.5 78.6
creation of jobs? First and second stage
of tertiary education Over 3 years 89.9 89.9 88.5 87.8 87.7 86.9 86.5
This section starts by looking at those Source: Eurostat, edat_lfse_24.
two groups on whom the legacy of the Note: ‘years after’ refers to years since completion of highest level of education.
crisis weighs most, namely youth and
the long-term unemployed. Next, it
on temporary contracts – a share that
takes a broader look at the employ- employers will be uncertain about
ment rates of various groups, the their likely reliability as individuals. On has increased since 2007, while it has
possible reasons for the differences the other hand, their recent education declined for those aged 25 or more.
in employment rates and possible
and better skills (e.g. ICT, language) However, the share working on tem-
ways to help curb these differences, may compensate for a lack of work porary contracts varies significantly
with some attention to the issues of experience, especially if it is seen to across Member States, reflecting their
employment protection legislation be relevant. different labour market regimes, being
and segmentation. less than 10 % in Romania and Lithu-
Young people often remain outsiders in ania and more than 60 % in Portugal,
In this long period of labour market countries with particularly segmented Spain, Poland and Slovenia.
labour markets, experiencing lower
weakness, with 2016 employment
still expected to be 0.5 % below the employment rates, more precarious Similarly, young people have a higher
2008 level according to the latest Com- employment conditions and higher than average share of part-time
-
mission forecast, job search has been unemployment rates than the over employment (almost one out of three),
(and still is) a difficult process for many all average. with a larger than average increase in
workers, with lasting effects, specifi- the share since 2007. In 2013, one out
cally those who searched for an entry While the employment rate of those of four male workers under 25 had a
(youth) or a re-entry (unemployed) into aged 25 or over fell by a little more part-time job, against one out of fif-
the labour market – the two groups we than 1 pps between 2007 and 2013, teen male workers aged 25 or older.
analyse here in detail. much larger falls were recorded for
those aged under 25. All these devel- As a result of the lower earnings asso-
3.1. Youth: more opments come with an education gra- ciated with temporary and part-time
education and better skills dient in the sense that people younger jobs ( ) young people with a job run a
53
can lessen the impact than 35 who left education at least higher than average risk of experiencing
of lack of experience three years ago have lower chances in-work poverty. However such terms
of being in employment than people and conditions are not always one-
The current labour market challenges with more education who left educa- sided. In Member States such as Ger-
facing young people are the result of tion less than three years ago (Table 2). many, the Netherlands, Luxembourg,
underlying structural problems which Austria, and Denmark, temporary con-
have been aggravated by the crisis. When they are employed, young people tracts include a significant portion of
are more likely to be subject to more apprenticeships or other employment
Young people have to overcome two precarious employment terms and
53
52
difficulties as a result of their lack of conditions ( ) with some 43 % being ( ) ‘The in-work poverty rate is on average almost
two times higher for people working on
work experience: firstly, they are likely temporary contracts or part-time’ – Chapter 4,
52
to be less productive initially compared ( ) These jobs often come with less pay, less ‘Is working enough to avoid poverty? In-work
security, less training and fewer pension
poverty mechanisms and policies in the EU’ in
to existing workers, and, secondly, rights. European Commission (2011a).
22