Page 16 - ePaper
P. 16
Employment and Social Developments in Europe 2014
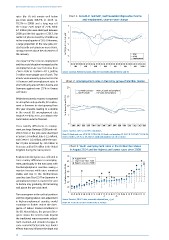
rates (for 20-64) remain well below Chart 1: Growth in real GDP, real household disposable income
pre-crisis levels (68.4 % in 2013 vs. and employment, year-on-year change
70.3 % in 2008) and a long way off
the Europe 2020 target of 75 %. While 4
6.7 million jobs were destroyed between 2
2008 and the first quarter of 2013, the
number of jobs increased by 1.8 million up 0
to the second quarter of 2014. Moreover,
a large proportion of the new jobs cre- % change on previous year -2
ated recently are temporary or part-time,
raising concerns about the robustness of -4
the recovery. GDP
-6 GDHI
Employment
The impact of the crisis on employment -8
and the social situation increased as the Q1 Q2 2007 Q3 Q4 Q1 Q2 2008 Q3 Q4 Q1 Q2 2009 Q3 Q4 Q1 Q2 2010 Q3 Q4 Q1 Q2 2011 Q3 Q4 Q1 Q2 2012 Q3 Q4 Q1 Q2 2013 Q3 Q4 Q1 2014 Q2
unemployment rate rose from less than
7 % in 2008 to 10.8 % in 2013, putting Source: Eurostat, National Accounts, data non-seasonally adjusted [namq_gdp_k]
9 million more people out of work. The
effects were unevenly spread across the
EU however, with unemployment rates in Chart 2: Unemployment rates in the EU by group of Member States
2013 still only around 5 % in Austria and
Germany against over 25 % in Greece 20
and Spain. EA North and core Non-EA South and periphery
EA South and periphery
Non-EA North
While the economic recovery is expected 15
to strengthen only gradually, EU employ -
ment is foreseen to start growing from % of labour force 15-74 10
this year onwards, leading to a decline
in the overall EU unemployment rate
towards 9.5 % by 2016, according to the 5
Commission autumn forecast.
0
Cross-country differences in employ- 2000 2001 2002 2003 2004 2005 2006 2007 2008 2009 2010 2011 2012 2013 2014
ment are large. Between 2008 and mid- Source: Eurostat, EU-LFS; DG EMPL calculations.
2014 most of the jobs were destroyed Note: EA North and core: AT BE DE FI FR LU NL, EA South and periphery: EE EL ES IE IT CY MT PT SI SK LV
in Spain (-3.4 million), Italy (-1.2 million), Non-EA north: CZ DK PL SE UK, Non-EA South and periphery: BG HR LT HU RO.
and Greece (-1.0 million), while the num -
ber of jobs increased by 1.8 million in
Germany, and by 0.9 million in the United Chart 3: Youth unemployment rates in the EU Member States
Kingdom during the same period. in August 2014 and the highest and lowest rates since 2008
Employment divergence was reflected in 70 August 2014
cross-country differences in unemploy- 60 Lowest rate since 2008
ment, particularly in the euro area, with Highest rate since 2008
Southern/peripheral countries seeing a 50
massive increase while rates remained 40
stable and low in the Northern/core % of labour force 15-24
countries (see Chart 2). The dispersion in 30
unemployment rates is expected to start 20
to decline only gradually, still remaining
well above the pre-crisis level. 10
0
The convergence in the cyclical positions DE AT NL DK EE MT LU UK CZ SI FI HU LT EU-28 SE LV BG PL EA-18 BE FR RO IE SK PT CY HR IT EL ES
and the ongoing labour cost adjustment Source: Eurostat, EU-LFS data, seasonally adjusted [une_rt_m].
in high-unemployment countries would Notes: EE EL HU UK Jul 2014 CY HR LV RO SI 2014Q2.
contribute to further reduce the diver-
gence of labour market conditions in
the EU. Nevertheless, the present diver-
gence shows the need to look beyond
the traditional macro-economic adjust-
ment channels and consider changes in
socio-economic factors and cross-border
effects that may influence the depth and
14