Page 147 - ePaper
P. 147
Chapter 3: The future of work in Europe: job quality and work organisation for a smart, sustainable and inclusive growth
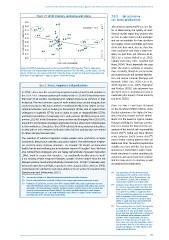
Chart 13: Work intensity, autonomy and stress 3.3.3. Job autonomy
can boost productivity
0.65 BG LT PT Correlation = -0.4 LOW Job control or autonomy ( ) is a core fac -
0.60
38
Not working to tight deadlines, q45b 0.50 SK ES AT FR HU CZ PL RO IT UK BE EL LU EE LV NL MT DK WI HIGH Several studies report that workers who
tor in determining the quality of work.
0.55
are free to make choices in the workplace
0.45
and are accountable for their decisions
0.40
are happier, more committed, put more
0.35
effort into their work, and are therefore
IE
0.30
dency to quit their job (Chirkov et al.,
0.25
2011 for a review; Mahdi et al., 2012;
0.20 DE CY SI FI SE more productive and show a lower ten-
-2 -1 0 1 2 3 Gellatly and Irving, 2001; Langfred and
Factor self-responsibility Moye, 2004). This is especially the case
Source: DG EMPL calculations based on the Eurofound EWCS 2010, question 45b. For explanation when the work is complex or requires
of the factor “self-responsibility” and the underlying questions from the EWCS, see the source , see the more creativity, though in a very routine
source of Chart 16. The colours of the circles show the degree of work stress (based on question 51n):
dark blue — low; light blue — high; and gray— about the average. job, autonomy can still increase satisfac -
tion and reduce turnover (DeCarlo and
Agarwal, 1999; Finn, 2001; Liu et al.,
Box 2: Stress, happiness and productivity 2005; Nguyen et al., 2003; Thompson
and Prottas, 2005). Job autonomy has
In 2014, stress was the second most-reported work-related health problem in also been seen as an important factor in
35
the EU. A 2013 European opinion poll conducted by EU-OSHA ( ) found that more moderating the impact of work intensity
than half of all workers considered work-related stress to be common in their (Liu et al., 2005).
workplace. The most common causes of work-related stress are job reorganisation
or job insecurity (72 %), hours worked or workload (66 %), being subject to unac- Chart 14, Chart 15 and Chart 16, based
ceptable behaviour such as bullying or harassment (59 %), lack of support from on the Eurofound EWCS (2010), show
colleagues or superiors (57 %), lack of clarity on roles or responsibilities (52 %), that job autonomy is the highest in Swe -
and limited possibility of managing one’s work patterns (46 %) (European Com- den, Denmark, Finland and the Nether-
mission, 2014d). In the Enterprise Survey on New and Emerging Risks (2010) ( ), lands. It is the lowest in Cyprus, Greece,
36
around 8 in 10 European managers expressed concern about work-related stress Portugal and Bulgaria. Germany and Aus -
in their workplaces, though less than 30 % admitted having implemented policies tria score among the lowest on the per-
to deal with its risks. Between 50 % and 60 % of all lost working days are related ceptions of the level of self-responsibility
39
to stress and psychosocial risks. (Chart 16)( ). Gallie and Zhou (2013),
using European Social Survey data( ),
40
The question of whether happiness makes people more productive occupies report similar country patterns that are
economists, behavioural scientists and policy makers. The well-being of employ- stable over time. The authors explain this
ees concerns many company managers. For example, “At Google, we know that stability over time with the fact that job
health, family and wellbeing are an important aspect of Googlers’ lives. We have autonomy is embedded in wider institu-
also noticed that employees who are happy demonstrate increased motivation tional structures. In some countries, job
...[We] ...work to ensure that Google is ...an emotionally healthy place to work” autonomy and control have been embed -
(Lara Harding, People Programs Manager, Google). Several studies show the link ded for many years at company as well
between positive mood and productivity (Oswald et al., 2014)( ), between well- as national level institutions.
37
being and motivation and higher capacity to solve anagrams (Erez and Isen, 2002),
and between job satisfaction and value added per hours worked in manufacturing
(Boeckerman and Ilmakunnas, 2012). ( ) Job autonomy can take different forms
38
depending on the country context and the
35
( ) See reports in figures at https://osha.europa.eu/en/safety-health-in-figures. organisational culture. Organisations may
( ) Results and publications available at https://osha.europa.eu/en/esener-enterprise-survey. let employees set their own schedules or
36
choose how and where to do their work.
( ) Oswald et al. (2014) set up three short (five-minute) GMAT-style maths experiments on more 39
37
than 700 individuals whose mood was measured and then manipulated with video clips, snacks ( ) Germany scores low in terms of control over
and drinks. The measurements took into account negative real-life events in the previous five the speed of own work (EWCS question 50c),
years (e.g. bereavement and family illness). The study concluded that those made happier order of tasks (50a), employee consultation
had productivity gains of 12 %, while individuals who suffered a major real-life shock in the on targets (51c), ability to apply own ideas
preceding five years showed lower productivity. (51i) and employee involvement in improving
work organisation (51d). Austria scores
low in terms of control over speed of work,
ability to apply own ideas and involvement
in improvements of work processes.
( ) There are three items in the ESS that provide
40
a measure of job control: how much ‘the
management at your work allows you (a) to
decide how your own daily work is organised;
(b) to influence policy decisions about the
activities of the organisation; and (c) to
choose or change your pace of work’. The
items then cover not only immediate control
over the work task (task discretion), but also
people’s perceptions of wider influence over
organisational decisions.
145