Page 150 - ePaper
P. 150
Employment and Social Developments in Europe 2014
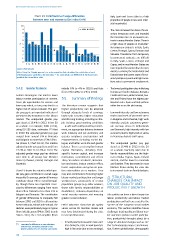
Chart 19: Contribution of wage differences Italy, Spain and Greece (due to a high
between men and women to Gini index (in %) proportion of people in low work-inten -
sity households).
10
9 2002 2010 • The crisis increased the share of invol-
8 untary temporary work and impeded
7 the transition rates to permanent con-
6 tracts in many Member States. There is
% 5 a high share of people on involuntar-
4 ily temporary contracts in Italy, Spain,
3 Greece, Portugal, Cyprus, Romania and
2 Slovakia. Transitions from temporary
1 to permanent contracts are difficult
0 in Italy, Spain, Greece, Portugal and
FI EE SK SE NO CZ UK ES CY DE FR NL EL BE PT HR IT PL LT LU HU LV BG RO Cyprus, and in most Member States are
Source: WiiW (2014). more impeded for women than for men.
Notes: Using the Shapley approach, i.e. a decomposition that calculates the contribution of each Austria, Germany, the Netherlands and
of thexexplanatory variables to the Gini index — for more details see WiiW (2014). No observation Estonia have the lowest rates of invol-
available for DE and HR in 2002. untary temporary work and high transi -
tions rates to permanent employment.
3.4.2. Gender balance initially 8 % to 4 % in 2010) and Italy • The lowest participation rates in life-long
(from 5 % in 2002 to 2 % in 2010). learning are found in Bulgaria, Romania,
Gender stereotypes can lead to lower Croatia and Greece, while Denmark, Swe -
labour market participation of women, 3.5. Summary of findings den and Finland have the highest par -
fewer job opportunities for women and ticipation rates. Spain and Italy perform
lower pay which, in turn, may lead to a The literature review suggests that rather low on on-the-job training.
higher risk of social exclusion. The gen- higher productivity can be attained
der pay gap is an important indicator of through adequate levels of earnings; • Low work intensity and low autonomy
persistent discrimination in the labour higher job security; higher education lead to low levels of perceived stress
market. The unadjusted gender pay and life-long training, including on-the- in Bulgaria and Lithuania; high work
gap stood at 16.4 % in 2012 in the EU job training; good working conditions intensity and job autonomy gener-
as a whole. For example, WiiW (2014), — a safe and healthy working environ- ate average stress in Netherlands
53
using EU-SES data, estimates ( ) that ment, an appropriate balance between and Denmark; high intensity with low
in 2010 the adjusted gender pay gap work intensity and job autonomy and autonomy lead to high levels of stress
ranged from around 5 % in Romania greater employee participation and in Germany, Austria and Cyprus.
-
and Bulgaria to more than 15 % in Esto- empowerment, including social dia
nia (Annex 3, Chart A3.11). The median logue; and better work-life and gender • The unadjusted gender pay gap
adjusted gender pay gap decreased from balance. These can strengthen human stood at 16.4 % in 2012 in the EU
13.2 % in 2002 to 10.4 % in 2010. The capital formation, including firm- as a whole. Inactivity rates due to
adjusted gender wage gap has declined specific human capital, and increase family responsibilities are the high-
over time in all except four Member motivation, commitment and effort. est in Malta, Cyprus, Spain, Ireland
States (Lithuania, Poland, Portugal and They can reduce accidents, absentee- and UK, and the lowest in Denmark
Slovakia). ism and stress, induce creative effort, and Sweden. They decreased in most
foster cooperation and generate posi- Member States during the crisis due
Chart 19 shows the extent to which gen- tive externalities on co-workers. They to increased strain on family budgets.
der pay gaps contribute to overall wage may also contribute to fostering higher
inequality. On average, gender differences labour market participation and longer 4. Structural
contribute about 3 % to overall inequal- working lives, particularly of certain changes can impact
ity, though there are important cross- population groups (e.g. older workers, on job quality and
country differences ranging from more those with family responsibilities or productivity growth
than 6 % in Finland to less than 1 % in disabilities), reducing dependency on
Bulgaria and Romania. The contribution social security systems and ensuring Job quality can have a direct impact on
of gender differences to inequality fell greater social cohesion. labour productivity and labour market
between 2002 and 2010 in all countries participation and both are crucial to the
except Lithuania, Poland and Portugal. The EMCO indicators show that job quality success of the European social market
declines were particularly large in Cyprus varies across EU Member States and economy. This section identifies future
(from initially around 9 % in 2002 to only may have deteriorated during the crisis challenges to job quality and labour mar -
3 % in 2010), the Czech Republic (from in several dimensions. ket outcomes (labour market participa-
tion, productivity) brought about by a
• In-work poverty increased in most coun - range of structural changes such as fur-
( ) Correcting for differences in age, education, tries during the crisis. In-work poverty is ther technological progress and innova-
53
contract type, occupation, enterprise type
(private, public), firm size, industry and country. high in Romania (due to low earnings), tion, further globalisation, demographic
148