Page 143 - ePaper
P. 143
Chapter 3: The future of work in Europe: job quality and work organisation for a smart, sustainable and inclusive growth
involuntary temporary work declined. In the evolution of involuntary temporary men have higher transition rates to per-
Finland and Portugal it increased slightly, work and transitions by country (Annex 3, manent contracts than women. Gender
but transitions improved. In Germany Charts A3.3–A3.8). differences in transition rates stand out
and Lithuania, involuntary temporary in Lithuania (30 pps), Estonia (15 pps) and
work declined and transitions to more There are significant gender inequalities in Cyprus (18 pps) (Annex 3, Charts A3.5).
stable employment contracts became the transition from temporary to perma- Women show better transition rates than
easier. Annex 3 gives more detail about nent contracts. In many Member States, men in Romania and Latvia. Annex 3 also
shows how transition rates evolved dur-
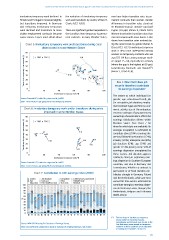
Chart 5: Involuntary temporary work and transitions during crisis ing the recent crisis by gender (Annex 3,
deteriorated in some Member States Charts A3.5–A3.7). Involuntary temporary
work is also more widespread among
80 2007 2013 SK workers on temporary contracts who are
Transitions temporary - permanent, % 50 LU LU HU LV CZ BG IT LV BG HU IT CZ EL ES EL SK CY (where the gap is the highest at 60 pps),
70
aged 55–64 than among younger work-
ers (aged 15–24), especially in Germany
60
25
Luxembourg, Denmark and Ireland( )
40
(Annex 3, Chart A3.8).
30
20
Box 1: How much does job
10
to earnings dispersion?
0 CY ES security (duration) contribute
0 20 40 60 80 100
Involuntary temporary work, %
The extent to which individual (i.e.
Source: Eurostat LFS, table lfsa_etgar and ilc_lvhl32. gender, age, educational level), job
Note: 15 to 64 years age group; % of total temporary workers. (i.e. occupation, job duration, employ-
ment contract type) and firm (i.e. eco -
Chart 6: Involuntary temporary work and/or transitions during crisis nomic activity, size of the enterprise,
improved in some Member States existence and type of pay agreement,
80 2007 2013 ownership) characteristics affect the
earnings distribution differs within
Transitions temporary - permanent, % 60 AT AT DE DE LT FI LT PL PT those for which data are available). On
70
Member States. (See Chart 7 for
average, occupation is estimated to
50
contribute about 25 % to earnings dis -
40
persion, followed by education (12 %),
30
industry (10 %), enterprise size (6 %),
job duration (6 %), age (5 %) and
20
10
earnings dispersion unexplained by
0 FI PL PT gender (3.5 %), leaving some 30 % of
0 20 40 60 80 100 these factors. Job duration appears
Involuntary temporary work, % relatively strong in explaining earn-
ings dispersion in Southern European
Source: Eurostat LFS, table lfsa_etgar and ilc_lvhl32.
Note: 15 to 64 years age group; % of total temporary workers. countries, and also in Germany and
Luxembourg. Whether a contract is
permanent or of fixed duration con-
Chart 7: Contribution to GINI earnings index (2010) tributes strongly in Germany, Poland
Gender Job duration Occupation Collective pay agreement and the Netherlands, while part-time
Age Contract NACE Public/Private versus full-time work is estimated to
Education Full-time/Part-time Size class Residual
100 contribute strongly to earnings disper -
90 sion in Germany, Latvia, Hungary, the
80 Netherlands, Belgium and Lithuania
70 (WiiW, 2014).
% 60
50
40
30
20
10
0
RO PT LV BG HU HR UK LT PL CY DE EE LU SK CZ ES NL IT EL FR BE FI NO SE
( ) The low share of involuntary temporary
25
young workers in Germany, Austria,
Source: WiiW (2014) using EU Structure of Earnings Survey. Luxembourg and Denmark may be due to the
fact that many young people on temporary
Note: Gini coefficient calculated on basis of earnings of employed persons, not income. contracts in these countries are in education
or training (see footnotes 20 and 22).
141
involuntary temporary work declined. In the evolution of involuntary temporary men have higher transition rates to per-
Finland and Portugal it increased slightly, work and transitions by country (Annex 3, manent contracts than women. Gender
but transitions improved. In Germany Charts A3.3–A3.8). differences in transition rates stand out
and Lithuania, involuntary temporary in Lithuania (30 pps), Estonia (15 pps) and
work declined and transitions to more There are significant gender inequalities in Cyprus (18 pps) (Annex 3, Charts A3.5).
stable employment contracts became the transition from temporary to perma- Women show better transition rates than
easier. Annex 3 gives more detail about nent contracts. In many Member States, men in Romania and Latvia. Annex 3 also
shows how transition rates evolved dur-
Chart 5: Involuntary temporary work and transitions during crisis ing the recent crisis by gender (Annex 3,
deteriorated in some Member States Charts A3.5–A3.7). Involuntary temporary
work is also more widespread among
80 2007 2013 SK workers on temporary contracts who are
Transitions temporary - permanent, % 50 LU LU HU LV CZ BG IT LV BG HU IT CZ EL ES EL SK CY (where the gap is the highest at 60 pps),
70
aged 55–64 than among younger work-
ers (aged 15–24), especially in Germany
60
25
Luxembourg, Denmark and Ireland( )
40
(Annex 3, Chart A3.8).
30
20
Box 1: How much does job
10
to earnings dispersion?
0 CY ES security (duration) contribute
0 20 40 60 80 100
Involuntary temporary work, %
The extent to which individual (i.e.
Source: Eurostat LFS, table lfsa_etgar and ilc_lvhl32. gender, age, educational level), job
Note: 15 to 64 years age group; % of total temporary workers. (i.e. occupation, job duration, employ-
ment contract type) and firm (i.e. eco -
Chart 6: Involuntary temporary work and/or transitions during crisis nomic activity, size of the enterprise,
improved in some Member States existence and type of pay agreement,
80 2007 2013 ownership) characteristics affect the
earnings distribution differs within
Transitions temporary - permanent, % 60 AT AT DE DE LT FI LT PL PT those for which data are available). On
70
Member States. (See Chart 7 for
average, occupation is estimated to
50
contribute about 25 % to earnings dis -
40
persion, followed by education (12 %),
30
industry (10 %), enterprise size (6 %),
job duration (6 %), age (5 %) and
20
10
earnings dispersion unexplained by
0 FI PL PT gender (3.5 %), leaving some 30 % of
0 20 40 60 80 100 these factors. Job duration appears
Involuntary temporary work, % relatively strong in explaining earn-
ings dispersion in Southern European
Source: Eurostat LFS, table lfsa_etgar and ilc_lvhl32.
Note: 15 to 64 years age group; % of total temporary workers. countries, and also in Germany and
Luxembourg. Whether a contract is
permanent or of fixed duration con-
Chart 7: Contribution to GINI earnings index (2010) tributes strongly in Germany, Poland
Gender Job duration Occupation Collective pay agreement and the Netherlands, while part-time
Age Contract NACE Public/Private versus full-time work is estimated to
Education Full-time/Part-time Size class Residual
100 contribute strongly to earnings disper -
90 sion in Germany, Latvia, Hungary, the
80 Netherlands, Belgium and Lithuania
70 (WiiW, 2014).
% 60
50
40
30
20
10
0
RO PT LV BG HU HR UK LT PL CY DE EE LU SK CZ ES NL IT EL FR BE FI NO SE
( ) The low share of involuntary temporary
25
young workers in Germany, Austria,
Source: WiiW (2014) using EU Structure of Earnings Survey. Luxembourg and Denmark may be due to the
fact that many young people on temporary
Note: Gini coefficient calculated on basis of earnings of employed persons, not income. contracts in these countries are in education
or training (see footnotes 20 and 22).
141