Page 144 - ePaper
P. 144
Employment and Social Developments in Europe 2014
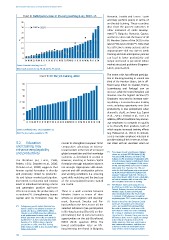
Chart 8: Participation rates in life-long learning (LLL), 2007–13 Romania, Croatia and Greece. Spain
and Italy perform poorly in terms of
35 on-the-job training. These countries
30 2007 2013 also show the poorest outcomes in
-
other indicators of skills develop
25 ment( ). Bulgaria, Romania, Cyprus,
27
20 and Greece also rank the lowest of all
% EU Member States of the OECD in the
15 latest PISA test (2012) ( ). Note that
28
10 less effective training systems and an
inappropriate skill mix due to weak
5 training and skill-anticipation policies
0 can lead to lower productivity and
BG RO HR EL SK HU PL LT IT LV BE CY IE MT DE CZ PT EU-28 ES SI EE AT LU UK NL FR FI SE DK output and result in persistent labour
Source: Eurostat table trng_lfse_02 market structural problems (fragmen-
Note: Break in series for CZ, FR, LU, LV, NL, PT and SE. tation, polarisation).
Chart 9: On-the-job training, 2010 The recent crisis has affected participa-
tion in life-long learning in around one
third of the Member States, but in dif-
60 ferent ways (Chart 8). Sweden, France,
Luxembourg and Portugal saw an
50
increase, while the United Kingdom and
29
40 Slovenia saw the highest declines ( ).
Employers may tend to increase train-
% 30 ing during a recession because training
costs, including opportunity costs (lost
20 productivity is less problematic when
demand is slack), are lower (e.g. Caponi
10
et al., 2010; Felstead et al., 2011). In
0 addition, difficult conditions may encour -
EL IT BG RO PT ES LT FR MT CY HU PL LV LU CZ EE EU-27 BE DE IE AT NL UK SI DK SE SK FI HR age employers to compete on quality
or to diversify their products, both of
Source: Eurofound, EWCS 2010, question 61c. which require increased training efforts
Note: No observation available for HR. (e.g. Felstead et al., 2011). In contrast,
a crisis can make employers reluctant to
provide training if this is seen as a finan-
3.2. Education crucial to strengthen European firms’ cial strain with an uncertain return on
and training may comparative advantage on interna-
enhance employability tional markets in the face of increased 27
and productivity global competition and the knowledge ( ) Percentage of early school leavers (highest
shares are in Spain (23.5 %), Malta (21 %),
economy, as developed in section 4. Portugal (19 %), Romania and Italy (17 %),
The literature (e.g. Lucas, 1988; However, investing in human capital Bulgaria (13 %); percentage of population with
at least medium computer skills (lowest shares
Rebelo, 1991; Dearden et al., 2006; formation through education alone is are in Romania (21 %), Bulgaria (29 %), Greece
Christen et al., 2008) suggests that not enough. Appropriate skill-devel- (41 %), and Italy (44 %). Data source: Eurostat,
tables [edat_lfse_14], [edat_lfse_08] and
human capital formation is directly opment and skill-anticipation policies under the link http://epp.eurostat.ec.europa.eu/
-
and positively linked to productivand working conditions (i.e. ensuring tgm/table.do?tab=table&init=1&plugin=1&l
anguage=en&pcode=tsdsc460. The data on
ity and labour market participation. good skills matching and the best use early school leavers refers to 2013, while data
Investment in education and training of the accumulated human capital) on level of computer skills is from 2012, the
latest available at the time of drafting.
leads to individual increasing returns are crucial. ( ) The Member States performing best on
28
and generates positive spill-over the PISA test in 2012 are the Netherlands,
Finland, Belgium, Germany and two new
effects increasing the productivity of There is a wide variation between Member States (Estonia and Poland).
co-workers ( ). Strengthening human Member States in terms of their More information about the PISA results
26
is available at http://www.oecd.org/pisa/
efforts to strengthen skill develop
capital and its formation may be - keyfindings/pisa-2012-results-overview.pdf
ment. Denmark, Sweden and Fin- ( ) Based on data from the European Social
29
land perform the best across all the Survey of 19 countries over the period
26
( ) Endogenous growth models illustrate how 2004–10, Dieckhoff (2010) found that
human capital accumulation increases the selected indicators (See participation the odds of training in 2010 were 20 %
growth rate (Lucas, 1988; Rebelo, 1991). in life-long learning (Chart 8), on-the- lower than in 2004, even after controlling
Christen et al. (2008) show that differences for a range of employee and workplace
in job performance between male and job training (Chart 9) and new learning characteristics. However, there were country
female physicians were fully accounted for opportunities on the job (Eurofound, differences: there was no significant change
by differences in their communication skills. in the volume of training in any of the
Dearden et al. (2006), using a dynamic EWCS 2010, question 49f)). The Nordic countries, there was an increase in
perspective on skills, show that training lowest participation rates on life- two Continental countries, and there was
which enhances skills is also associated with a decrease in the UK and Ireland and in
higher productivity. long learning are found in Bulgaria, some of the Eastern European countries.
142