Page 141 - ePaper
P. 141
Chapter 3: The future of work in Europe: job quality and work organisation for a smart, sustainable and inclusive growth
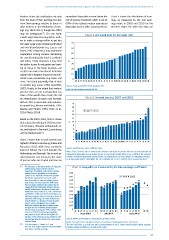
Workers derive job satisfaction not only equivalised disposable income below the Chart 3 shows the distribution of earn-
from the level of their earnings but also risk-of-poverty threshold, which is set at ings, as measured by the Gini earn-
from their earnings relative to those of 60 % of the national median equivalised ings index, in 2000 and 2010 for the
other workers, i.e. the distribution of earn- disposable income (after social transfers). Member States for which the data are
ings (e.g. OECD 2014), though the effect
13
may be ambiguous( ). On one hand, Chart 1: Am I well paid for the work I do?
a wider wage dispersion may induce work -
ers to make a stronger effort to get into
the upper wage scale, increasing individual 70
and overall productivity (e.g. Lazear and 60
Rosen, 1981). However, it may undermine
cooperation among workers, decreasing 50
the overall productivity level (e.g. Akerlof 40
and Yellen, 1990). Moreover, it may limit %
the ability to pay for education and train- 30
ing of those in the lower brackets and 20
result in an under-investment in human
capital with a negative impact on the indi- 10
vidual’s own productivity (e.g. Galor and 0
Zeira, 1993) and potentially that of their HU LT PT LV SK BG RO EE IT FR EL SI CZ FI PL ES EU-27 SE DE MT AT IE UK BE CY NL LU DK HR
co-workers (e.g. Lucas, 1988; Lloyd-Ellis, Source: Eurofound, EWCS 2010, question 77b.
2003). Finally, to the extent that workers Note: No observation available for HR.
perceive they are not receiving their fair
share of the wealth they create, the call
for redistribution via taxes may increase, Chart 2: In-work poverty, 2007 and 2013
with an effect on innovation and productiv - 20
ity growth (e.g. Alesina and Rodrik, 1994; 18
Alesina and Perotti, 1994; Ostry et al., 16 2007
2014; Piketty 2014). 2013
14
Based on the EWCS 2010, Chart 1 shows 12
that satisfaction with pay in 2010 was low- % 10
est in Hungary, Lithuania, Portugal and Lat - 8
via, and highest in Denmark, Luxembourg 6
and the Netherlands ( ). 4
14
2
Chart 2 shows that in-work poverty was 0 FI CZ NL DK BE IE SK MT HU SI SE BG EE AT FR UK DE EU-28 CY LV LT PT ES IT PL LU EL RO
highest in Poland, Luxembourg, Greece and
Romania in 2013, while it was among the Source: Eurostat SILC, 2012, table: ilc_iw01.
lowest in Finland, the Czech Republic, the Notes: The in-work at-risk-of-poverty rate measures the share of persons who are at work and have an
Netherlands and Denmark. The in-work at- equivalised disposable income below the risk-of-poverty threshold, which is set at 60 % of the national
risk-of-poverty rate measures the share median equivalised disposable income (after social transfers). For more details see http://epp.eurostat.
of persons who are at work and have an ec.europa.eu/cache/ITY_OFFPUB/KS-RA-10-015/EN/KS-RA-10-015-EN.PDF; 2012 observation for IE.
( ) The literature on the determinants of subjective Chart 3: Inequality as measured by the Gini earnings coefficient
13
well-being has focused on the relative
importance of absolute and relative earnings,
without however providing for a conclusive 0.50
answer so far. Easterlin (1974), who sparked 0.45 2000 2010
the debate, argued that once basic needs
have been met it is only the relative income 0.40
that matters for increasing one’s well-being. 0.35
Recent studies challenged this proposition by
arguing that the relationship between income 0.30
and life satisfaction is log-linear (Deaton and
Kahneman, 2010; Sacks et al., 2012; Stevenson 0.25
and Wolfers, 2008 and 2013), or that there are 0.20
declining marginal returns to income in terms of
subjective well-being, from which follows that 0.15
overall welfare is a function of both absolute 0.10
income and its distribution. Most studies
that have analysed the role of relative wage 0.05
comparisons for well-being found negative
effects (Clark and Oswald, 1996; Luttmer, 2005; 0 SE BE FR EL ES EE LT LV SK LU PL UK BG RO FI IT NL CZ CY HU PT HR DE
Card et al., 2012) that have been typically
interpreted as status effects: the higher the Decrease: 2000-10 Stable: 2000-10 Increase: 2000-10
earnings of the reference group relative to one’s
personal earnings, the lower one’s social status Source: WiiW (2014) using EU Structure of Earnings Survey.
and well-being. Notes: Gini coefficient calculated on basis of earnings of employed persons, not income.
14
( ) See also Annex 3, Charts A3.1 and The Gini coefficient is an indicator with a value between 0 and 1. Lower values indicate higher equality.
A3.2 for real wages adjusted for productivity No observation available for HR and DE for 2000.
and mean monthly earnings.
139