Page 68 - Consumers and Mobile Financial Services 2014
P. 68
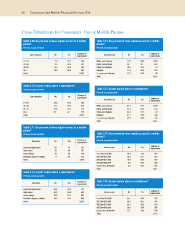
60 Consumers and Mobile Financial Services 2014
Cross-Tabulations for Consumers’ Use of Mobile Phones
Table C.69. Do you own or have regular access to a mobile Table C.73. Do you own or have regular access to a mobile
phone? phone?
Percent, except as noted Percent, except as noted
Number of Number of
Age categories No Yes Race/ethnicity No Yes
respondents respondents
18–29 7.9 92.1 360 White, non-Hispanic 11.5 88.5 2,035
30–44 9.5 90.5 587 Black, non-Hispanic 20 80 225
45–59 13.4 86.6 803 Other, non-Hispanic 16.6 83.4 84
60+ 19.2 80.8 907 Hispanic 11.4 88.6 218
Total 2,657 2+ races, non-Hispanic 11.5 88.5 95
Total 2,657
Table C.70. Is your mobile phone a smartphone?
Percent, except as noted Table C.74. Is your mobile phone a smartphone?
Percent, except as noted
Number of
Age categories No Yes
respondents Number of
Race/ethnicity No Yes
respondents
18–29 20.8 79.2 330
30–44 23.1 76.9 529 White, non-Hispanic 42.3 57.7 1,799
45–59 41.8 58.2 712 Black, non-Hispanic 37.4 62.6 183
60+ 67 33 756 Other, non-Hispanic 22.3 77.7 72
Total 2,327 Hispanic 27.1 72.9 188
2+ races, non-Hispanic 35.5 64.5 85
Total 2,327
Table C.71. Do you own or have regular access to a mobile
phone?
Percent, except as noted Table C.75. Do you own or have regular access to a mobile
phone?
Number of Percent, except as noted
Education No Yes
respondents
Number of
Less than high school 28 72 191 Income group No Yes
respondents
High school 16 84 767
Some college 10 90 746 Less than $25,000 26.4 73.6 407
Bachelor’s degree or higher 6 94 953 $25,000–$39,999 16.3 83.7 418
Total 2,657 $40,000–$74,999 10.6 89.4 687
$75,000–$99,999 6.5 93.5 394
Greater than $100,000 4.3 95.7 751
Total 2,657
Table C.72. Is your mobile phone a smartphone?
Percent, except as noted
Number of Table C.76. Is your mobile phone a smartphone?
Education No Yes
respondents
Percent, except as noted
Less than high school 50.8 49.2 137
High school 45.5 54.5 643 Income group No Yes Number of
respondents
Some college 36.9 63.1 661
Bachelor’s degree or higher 29.3 70.7 886 Less than $25,000 55.7 44.3 302
Total 2,327 $25,000–$39,999 50.3 49.7 345
$40,000–$74,999 36.7 63.3 615
$75,000–$99,999 29.6 70.4 365
Greater than $100,000 25.2 74.8 700
Total 2,275