Page 69 - Consumers and Mobile Financial Services 2014
P. 69
March 2014 61
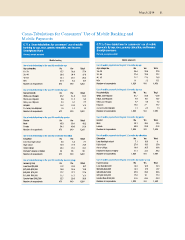
Cross-Tabulations for Consumers’ Use of Mobile Banking and
Mobile Payments
C.77.a. Cross-tabulations for consumers’ use of mobile C.77.b. Cross-tabulations for consumers’ use of mobile
banking by age, race, gender, education, and income: payments by age, race, gender, education, and income:
Smartphone Users Smartphone users
Percent, except as noted Percent, except as noted
Mobile banking Mobile payments
Use of mobile banking in the past 12 months by age Use of mobile payments in the past 12 months by age
Age categories No Yes Total Age categories No Yes Total
18–29 15.7 38.8 27.4 18–29 25.4 35.6 27.9
30–44 30.8 34.4 32.6 30–44 32.4 35.8 33.2
45–59 32.1 20.7 26.3 45–59 27.2 21.5 25.8
60+ 21.4 6.2 13.7 60+ 15 7.2 13.1
Number of respondents 673 610 1,283 Number of respondents 1,028 331 1,359
Use of mobile banking in the past 12 months by race Use of mobile payments in the past 12 months by race
Race/ethnicity No Yes Total Race/ethnicity No Yes Total
White, non-Hispanic 67.2 61.8 64.4 White, non-Hispanic 67.7 50.9 63.6
Black, non-Hispanic 6.9 11.5 9.3 Black, non-Hispanic 7.9 19.1 10.7
Other, non-Hispanic 9.3 6.1 7.7 Other, non-Hispanic 7.7 5.6 7.2
Hispanic 15.2 19.2 17.2 Hispanic 15.6 22 17.2
2+ races, non-Hispanic 1.5 1.4 1.4 2+ races, non-Hispanic 1.1 2.4 1.4
Number of respondents 673 610 1,283 Number of respondents 1,028 331 1,359
Use of mobile banking in the past 12 months by gender Use of mobile payments in the past 12 months by gender
Gender No Yes Total Gender No Yes Total
Male 45.9 50.4 48.2 Male 49.1 46.5 48.5
Female 54.1 49.6 51.8 Female 50.9 53.5 51.5
Number of respondents 673 610 1,283 Number of respondents 1,028 331 1,359
Use of mobile banking in the past 12 months by education Use of mobile payments in the past 12 months by education
Education No Yes Total Education No Yes Total
Less than high school 8.8 5.4 7.1 Less than high school 7.1 10.6 8
High school 26.9 22.9 24.9 High school 27.4 19.3 25.4
Some college 26.3 33.7 30.1 Some college 28.4 36.5 30.4
Bachelor’s degree or higher 38 38 38 Bachelor’s degree or higher 37.1 33.5 36.2
Number of respondents 673 610 1,283 Number of respondents 1,028 331 1,359
Use of mobile banking in the past 12 months by income group Use of mobile payments in the past 12 months by income group
Income group No Yes Total Income group No Yes Total
Less than $25,000 11.2 10.2 10.7 Less than $25,000 12.3 12.6 12.4
$25,000–$39,999 10.6 16.4 13.6 $25,000–$39,999 12.4 17.5 13.7
$40,000–$74,999 27.7 27.2 27.4 $40,000–$74,999 25.9 29.3 26.8
$75,000–$99,999 17.7 17.3 17.5 $75,000–$99,999 17.8 16 17.3
Greater than $100,000 32.7 28.9 30.8 Greater than $100,000 31.6 24.5 29.9
Number of respondents 673 610 1,283 Number of respondents 1,028 331 1,359