Page 297 - ePaper
P. 297
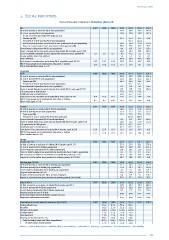
Statistical annex
3. Social indicators
Social Inclusion Indicators: European Union 28
All 2007 2008 2009 2010 2011 2012 2013
At-risk-of-poverty or exclusion (% of total population) 23.8 24.4 24.8 24.5 e
At-risk-of-poverty (% of total population) 16.5 17.0 16.9 16.7 e
At-risk-of-poverty threshold (PPS single person)
Poverty gap (%) 23.5 23.4 23.5 23.8
Persistent at-risk-of-poverty (% of total population) 9.6 e 10.2 e
At-risk-of-poverty before social transfers excl. pensions (% of total population) 26.0 26.4 25.8 25.8 e
Impact of social transfers (excl. pensions) in reducing poverty (%) 36.5 35.6 34.5 35.3
Severe Material Deprivation (% of total population) 8.4 8.9 9.9 9.6 e
Share of people living in low work intensity households (% of people aged 0-59) 10.2 10.4 10.5 10.7 e
Gross Household Disposable income adjusted for consumer prices (growth %) 1.9 1.0 0.7 -0.4 -0.2 -1.1 -0.2
Income quintile share ratio S80/S20 5.0 5.1 5.0 5.0
GINI coefficient 30.5 30.8 30.4 30.5
Early leavers from education and training (% of population aged 18-24) 14.9 14.7 14.2 13.9 13.4 12.7 12.0
NEET: Young people not in employment, education or training 10.9 10.8 12.4 12.7 12.9 13.1 13.0
(% of total population aged 15-24)
By gender
Male 2007 2008 2009 2010 2011 2012 2013
At-risk-of-poverty or exclusion (% of male population) 22.6 23.3 23.8 23.6 e
At-risk-of-poverty (% of male population) 15.8 16.2 16.3 16.1 e
Poverty gap (%) 24.3 24.5 24.5 24.5
Persistent at-risk-of-poverty (% of male population) 9.1 e 9.5 e
Severe Material Deprivation (% of male population) 8.2 8.6 9.6 9.4 e
Share of people living in low work intensity households (% of males aged 0-59) 9.5 9.8 9.9 10.2 e
Life expectancy at birth (years) 77.0 77.4 77.5
Healthy life years at birth (years) 61.9 61.7 61.5
Early leavers from education and training (% of males aged 18-24) 16.9 16.6 16.1 15.8 15.3 14.4 13.6
NEET: Young people not in employment, education or training 9.7 9.7 12.0 12.3 12.5 12.9 12.8
(% of males aged 15-24)
Female 2007 2008 2009 2010 2011 2012 2013
At-risk-of-poverty or exclusion (% of female population) 24.8 25.4 25.8 25.4 e
At-risk-of-poverty (% of female population) 17.2 17.7 17.5 17.2 e
Poverty gap (%) 22.5 22.5 22.6 23.1
Persistent at-risk-of-poverty (% of female population) 10.1 e 10.8 e
Severe Material Deprivation (% of female population) 8.6 9.2 10.2 9.8 e
Share of people living in low work intensity households (% of females aged 0-59) 10.9 11.1 11.0 11.2 e
Life expectancy at birth (years) 82.9 83.2 83.1
Healthy life years at birth (years) 62.7 62.2 62.1
Early leavers from education and training (% of females aged 18-24) 12.8 12.6 12.3 11.9 11.5 10.9 10.2
NEET: Young people not in employment, education or training 12.1 12.0 12.9 13.2 13.3 13.4 13.3
(% of females aged 15-24)
By age
Children (0-17) 2007 2008 2009 2010 2011 2012 2013
At-Risk-of-poverty or exclusion of children (% of people aged 0-17) 27.4 27.4 28.1 27.6 e
At-risk-of-poverty (% of Children population) 20.8 20.8 20.7 20.3 e
Severe Material Deprivation (% of Children population) 9.8 10.1 11.8 11.0 e
Share of children living in low work intensity households (% of Children population) 9.3 9.2 9.1 9.3 e
Risk of poverty of children in households at work (Working Intensity > 0.2) 15.7 15.7 15.9 15.6 e
Impact of social transfers (excl. pensions) in reducing poverty (0-17) (%) 40.7 40.6 39.3 41.3
Working age (18-64) 2007 2008 2009 2010 2011 2012 2013
At-risk-of-poverty or exclusion (% of Working age population) 23.7 24.5 25.4 25.3 e
At-risk-of-poverty (% of Working age population) 15.4 16.1 16.5 16.4 e
Severe Material Deprivation (% of Working age population) 81 91 101 101 e
Very low work intensity (18-59) 10.5 10.8 10.9 11.1 e
In-work at-risk-of poverty rate (% of persons employed) 8.4 8.9 9.1 8.9 e
Impact of social transfers (excl. pensions) in reducing poverty (18-64) (%) 38.2 37.1 35.0 36.2
Elderly (65+) 2007 2008 2009 2010 2011 2012 2013
At-Risk-of-poverty or exclusion of elderly (% of people aged 65+) 19.9 20.4 19.4 18.3 e
At-risk-of-poverty (% of Elderly population) 15.9 15.9 14.6 13.8 e
Severe Material Deprivation (% of Elderly population) 6.7 7.2 7.5 7.0 e
Relative median income of elderly 0.88 0.89 0.91 0.93
(ratio with median income of people younger than 65)
Aggregate replacement ratio (ratio) 0.53 0.54 0.54 0.56
Expenditure in social protection indicators (% of GDP) 2007 2008 2009 2010 2011 2012 2013
Sickness/Health care 7.6 p 8.4 p 8.3 p 8.3 p
Disability 2.0 p 2.1 p 2.1 p 2.1 p
Old age and survivors 11.8 p 12.8 p 12.8 p 12.8 p
Family/Children 2.1 p 2.3 p 2.3 p 2.2 p
Unemployment 1.3 p 1.7 p 1.6 p 1.5 p
Housing and Social exclusion n.e.c. 0.9 p 1.0 p 1.0 p 1.0 p
Total (including Admin and Other expenditures) 26.7 p 29.5 p 29.4 p 29.0 p
of which: Means tested benefits 2.7 p 3.0 p 3.0 p 3.0 p
Notes: b = break in time series; d = definition differs, see metadata; e = estimated; f = forecast; p = provisional; s = Eurostat estimate; u = low reliability.
295