Page 49 - State-of-the-Industry-2013
P. 49
Part 1 - mOBile mOney
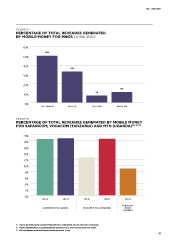
Figure 17
Percentage of total revenues generateD
bY mobile moneY for mnos (June 2013)
60%
50%
50%
40%
32%
30%
20%
11%
7%
10%
0%
LESS THAN 1% 1% TO 5% 5% TO 10% ABOVE 10%
Figure 18
Percentage of total revenues generateD bY mobile moneY
for safaricom, voDacom (tanZania) anD mtn (uganDa) 30 31 32
20%
18%
16%
14%
12%
10%
8%
6%
4%
2%
0%
SEP-12 SEP-13 SEP-12 SEP-13 DEC-12
MTN MOBILE
SAFARICOM M-PESA (KENyA) VODACOM M-PESA (TANZANIA) MONEy
(UGANDA)
30. Safaricom: http://www.safaricom.co.ke/images/downloads/resources_downloads/half_year_2013-2014_results_Presentation.pdf
31. vodacom: http://www.vodacom.co.za/cs/groups/public/documents/vodacom.co.za_portal_webassets/announcement_new.pdf
32. mtn: https://www.mtn.com/investors/Financials/documents/presentation_2012.pdf
43