Page 133 - ePaper
P. 133
Chapter 2: Investing in human capital and responding to long-term societal challenges
Annex
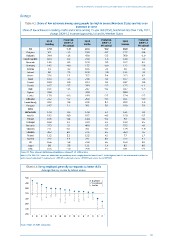
Table A.1: Share of low achievers among young people too high in several Members States and has even
increased in some
Share of low achievers in reading, maths and science among 15 year olds (PISA), benchmark less than 15 %, 2012,
change 2009–12 in percentage points, EU and EU Member States
2012 Evolution 2012 Evolution 2012 Evolution
2009-12
2009-12
2009-12
Reading (% points) Maths (% points) Science (% points)
EU 17.8 -1.9 22.1 -0.2 16.6 -1.2
Belgium 16.1 -1.5 19.0 -0.2 17.7 -0.4
Bulgaria 39.4 -1.6 43.8 -3.3 36.9 -1.9
Czech Republic 16.9 -6.2 21.0 -1.3 13.8 -3.5
Denmark 14.6 -0.6 16.8 -0.3 16.7 0.1
Germany 14.5 -4.0 17.7 -0.9 12.2 -2.6
Estonia 9.1 -4.2 10.5 -2.1 5.0 -3.3
Ireland 9.6 -7.6 16.9 -3.9 11.1 -4.1
Greece 22.6 1.3 35.7 5.4 25.5 0.2
Spain 18.3 -1.3 23.6 -0.1 15.7 -2.5
France 18.9 -0.9 22.4 -0.1 18.7 -0.6
Croatia 18.7 -3.7 29.9 -3.3 17.3 -1.2
Italy 19.5 -1.5 24.7 -0.2 18.7 -1.9
Cyprus 32.8 : 42.0 : 38.0 :
Latvia 17.0 -0.6 19.9 -2.7 12.4 -2.3
Lithuania 21.2 -3.2 26.0 -0.3 16.1 -0.9
Luxembourg 22.2 -3.8 24.3 0.4 22.2 -1.5
Hungary 19.7 2.1 28.1 5.8 18.0 3.9
Malta : : : : : :
Netherlands 14.0 -0.3 14.8 1.4 13.1 -0.1
Austria 19.5 -8.0 18.7 -4.5 15.8 -5.2
Poland 10.6 -4.4 14.4 -6.1 9.0 -4.1
Portugal 18.8 1.2 24.9 1.2 19.0 2.5
Romania 37.3 -3.1 40.8 -6.2 37.3 -4.1
Slovenia 21.1 -0.1 20.1 -0.2 12.9 -1.9
Slovakia 28.2 6.0 27.5 6.5 26.9 7.6
Finland 11.3 3.2 12.3 4.5 7.7 1.7
Sweden 22.7 5.3 27.1 6.0 22.2 3.1
UK 16.6 -1.8 21.8 1.6 15.0 0.0
Japan 9.8 -3.8 11.1 -1.4 8.5 0.0
USA 16.6 -1.0 25.8 2.5 18.1 -2.2
Source: EC Press release, http://europa.eu/rapid/press-release_IP-13-1198_en.htm.
Note: [1] The PISA 2012 scores are divided into six proficiency levels ranging from the lowest, level 1, to the highest, level 6. Low achievement is defined as
performance below level 2: reading (score <407.47), mathematics (score <420.07) and science (score<409.54).
Chart A.1: Being employed generally corresponds to better skills
Average literacy scores by labour status
300
Employed
290 Unemployed
Inactive
280
270
260
250
240
230
FI NL SE BE SK EE UK DK CZ DE IE AT CY PL ES IT
Source: PIAAC, DG EMPL elaboration.
131
Annex
Table A.1: Share of low achievers among young people too high in several Members States and has even
increased in some
Share of low achievers in reading, maths and science among 15 year olds (PISA), benchmark less than 15 %, 2012,
change 2009–12 in percentage points, EU and EU Member States
2012 Evolution 2012 Evolution 2012 Evolution
2009-12
2009-12
2009-12
Reading (% points) Maths (% points) Science (% points)
EU 17.8 -1.9 22.1 -0.2 16.6 -1.2
Belgium 16.1 -1.5 19.0 -0.2 17.7 -0.4
Bulgaria 39.4 -1.6 43.8 -3.3 36.9 -1.9
Czech Republic 16.9 -6.2 21.0 -1.3 13.8 -3.5
Denmark 14.6 -0.6 16.8 -0.3 16.7 0.1
Germany 14.5 -4.0 17.7 -0.9 12.2 -2.6
Estonia 9.1 -4.2 10.5 -2.1 5.0 -3.3
Ireland 9.6 -7.6 16.9 -3.9 11.1 -4.1
Greece 22.6 1.3 35.7 5.4 25.5 0.2
Spain 18.3 -1.3 23.6 -0.1 15.7 -2.5
France 18.9 -0.9 22.4 -0.1 18.7 -0.6
Croatia 18.7 -3.7 29.9 -3.3 17.3 -1.2
Italy 19.5 -1.5 24.7 -0.2 18.7 -1.9
Cyprus 32.8 : 42.0 : 38.0 :
Latvia 17.0 -0.6 19.9 -2.7 12.4 -2.3
Lithuania 21.2 -3.2 26.0 -0.3 16.1 -0.9
Luxembourg 22.2 -3.8 24.3 0.4 22.2 -1.5
Hungary 19.7 2.1 28.1 5.8 18.0 3.9
Malta : : : : : :
Netherlands 14.0 -0.3 14.8 1.4 13.1 -0.1
Austria 19.5 -8.0 18.7 -4.5 15.8 -5.2
Poland 10.6 -4.4 14.4 -6.1 9.0 -4.1
Portugal 18.8 1.2 24.9 1.2 19.0 2.5
Romania 37.3 -3.1 40.8 -6.2 37.3 -4.1
Slovenia 21.1 -0.1 20.1 -0.2 12.9 -1.9
Slovakia 28.2 6.0 27.5 6.5 26.9 7.6
Finland 11.3 3.2 12.3 4.5 7.7 1.7
Sweden 22.7 5.3 27.1 6.0 22.2 3.1
UK 16.6 -1.8 21.8 1.6 15.0 0.0
Japan 9.8 -3.8 11.1 -1.4 8.5 0.0
USA 16.6 -1.0 25.8 2.5 18.1 -2.2
Source: EC Press release, http://europa.eu/rapid/press-release_IP-13-1198_en.htm.
Note: [1] The PISA 2012 scores are divided into six proficiency levels ranging from the lowest, level 1, to the highest, level 6. Low achievement is defined as
performance below level 2: reading (score <407.47), mathematics (score <420.07) and science (score<409.54).
Chart A.1: Being employed generally corresponds to better skills
Average literacy scores by labour status
300
Employed
290 Unemployed
Inactive
280
270
260
250
240
230
FI NL SE BE SK EE UK DK CZ DE IE AT CY PL ES IT
Source: PIAAC, DG EMPL elaboration.
131