Page 131 - ePaper
P. 131
Chapter 2: Investing in human capital and responding to long-term societal challenges
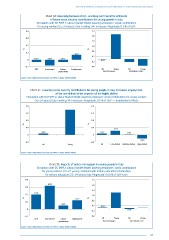
Chart 30: Balancing between short- and long-term benefits and costs
of lower social security contributions for young people in Italy
Simulation with DG EMPL’s Labour Market Model: lowering employers’ social contributions
for young workers (15–24 years), Italy. Funding: VAT increases. Magnitude: 0.1 % of GDP
0.4 2.2
1.8
0.3
1.4
0.2 1.0
% %
0.1 0.6
0.07
0.2
0 -0.03 -0.08 -0.03 -0.03
-0.2
-0.1 -0.6
GDP Investment Labour Employment All Young All Young
productivity Real net wages Real labour costs
Source: Own calculations based on DG EMPL’s Labour Market Model.
Chart 31: Lowering social security contributions for young people in Italy increases employment
of the low-skilled at the expense of the highly skilled
Simulation with DG EMPL’s Labour Market Model: lowering employers’ social contributions for young workers
(15–24 years), Italy. Funding: VAT increases. Magnitude: 0.1 % of GDP — employment effects
1.6 1.6
1.2 1.2
0.8 0.8
% %
0.4 0.4 0.23
0.07 0.07 0.02
0 0
-0.20
-0.4 -0.4
All Young All Low-skilled Medium-skilled High-skilled
Source: Own calculations based on DG EMPL’s Labour Market Model.
Chart 32: Impacts of policy mix support to young people in Italy
Simulation with DG EMPL’s Labour Market Model: lowering employers’ social contributions
for young workers (15–24 years), combined with tertiary education scholarships
for tertiary education (20–24 years), Italy. Magnitude: 0.05 % of GDP each
0.4 2.2
0.32 1.8
0.3
1.4
0.2 0.20 1.0
% %
0.12
0.1 0.6
0.05
0.2 0.03
0 -0.07
-0.2
-0.1 -0.6
GDP Investment Labour Employment All Young All Young
productivity Real net wages Real labour costs
Source: Own calculations based on DG EMPL’s Labour Market Model.
129