Page 15 - State-of-the-Industry-2013
P. 15
Part 1 - mOBile mOney
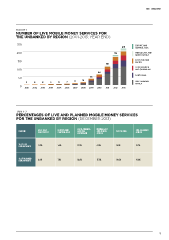
Figure 1
number of live mobile moneY services for
the unbankeD bY region (2001-2013; year end)
250 EUROPE AND
219 CENTRAL ASIA
200 179 MIDDLE EAST AND
NORTH AFRICA
150 EAST ASIA AND
PACIFIC
116
LATIN AMERICA
100 AND CARIBBEAN
64
SOUTH ASIA
50 16 38
1 2 2 5 6 7 11 SUB-SAHARAN
AFRICA
0
2001 2002 2003 2004 2005 2006 2007 2008 2009 2010 2011 2012 2013
Table 2
Percentages of live anD PlanneD mobile moneY services
for the unbankeD bY region (december 2013)
region eaSt aSia europe and latin aMeriCa Middle eaSt South aSia Sub-Saharan
and the
and north
afriCa
and paCifiC
Central aSia
afriCa
Caribbean
% of live
deployMentS 11.5% 1.4% 13.3% 6.0% 16.1% 51.7%
% of planned
deployMentS 8.8% 7.1% 18.6% 13.3% 10.6% 41.6%
9