Page 17 - PostEurop Business Forum
P. 17

Brody BUHLER - Managing Director, Global Accenture
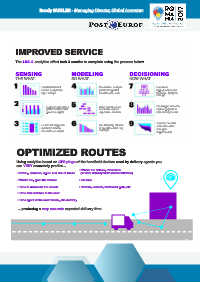


          IMPROVED SERVICE


          The LEG 2 analytics effort took 3 months to complete using the process below.


          SENSING                          MODELING                           DECISIONING
          THE WHAT                         SO WHAT                            NOW WHAT


                          Used basic Root                   Correlation analysis              Prioritized
                          Cause analysis for                yielded impactful                 opportunity areas
                          leg 2 delays                      conditions/events                 based on ability to
                                                                                              change


                            Explored operations             Used decision tree                Developed Lean Six
                            systems that could              and multi-variant                 Sigma projects to
                            provide insights                regression models                 address key areas


                          Linked 20 disparate               Identified top 20 sets            Tracked benefits
                          systems’ data for                 of condition with Leg             realization after
                          correlation analysis              2 delays                          changes
                                                                                              implemented
                                                                                      Copyright © 2017 Accenture  All rights reserved.    |  12
                                                                                                              12
           OPTIMIZED ROUTES


           Using analytics based on GPS pings of the handheld devices used by delivery agents you
           can VERY accurately predict…
                                                • Where the delivery was made
           • Driving distance, speed and line of travel  (ie were delivery instructions followed)
           • Where they park the vehicle        • Idle time

           • Time to dismount the vehicle       • Rework, detours, inefficient path, etc
           • Time and distance to the door

           • Time spent at the door making the delivery

            …producing a very accurate expected delivery time.


                                                                                       Copyright © 2017 Accenture  All rights reserved.    |  13
   12   13   14   15   16   17   18   19   20   21   22