Page 309 - ePaper
P. 309
Statistical annex
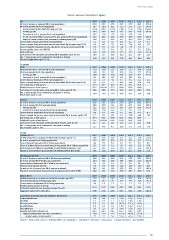
Social Inclusion Indicators: Spain
All 2007 2008 2009 2010 2011 2012 2013
At-risk-of-poverty or exclusion (% of total population) 23.3 24.5 24.5 26.7 27.7 28.2 27.3 b
At-risk-of-poverty (% of total population) 19.7 20.8 20.1 21.4 22.2 22.2 20.4 b
At-risk-of-poverty threshold (PPS single person) 7 614 8 161 8 114 7 780 7 532 7 416 8 543 b
Poverty gap (%) 25.9 24.4 28.9 32.3 30.9 31.4 30.9 b
Persistent at-risk-of-poverty (% of total population) 10.2 11.0 12.5 11.6 11.4 11.6
At-risk-of-poverty before social transfers excl. pensions (% of total population) 23.7 25.2 25.2 28.8 30.0 29.6 30.0 b
Impact of social transfers (excl. pensions) in reducing poverty (%) 16.9 17.5 20.2 25.7 26.0 25.0 32.0
Severe Material Deprivation (% of total population) 3.5 3.6 4.5 4.9 4.5 5.8 6.2
Share of people living in low work intensity households (% of people aged 0-59) 6.8 6.6 7.6 10.8 13.4 14.3 15.7
Gross Household Disposable income adjusted for consumer prices (growth %) 3.3 3.2 1.6 -4.4 -2.5 -5.2
Income quintile share ratio S80/S20 5.5 5.7 6.4 7.2 7.1 7.2 6.3 b
GINI coefficient 31.9 31.9 33.0 34.4 34.5 35.0 33.7 b
Early leavers from education and training (% of population aged 18-24) 30.8 31.7 30.9 28.2 26.3 24.7 23.6
NEET: Young people not in employment, education or training 12.0 14.3 18.1 17.8 18.2 18.6 18.6
(% of total population aged 15-24)
By gender
Male 2007 2008 2009 2010 2011 2012 2013
At-risk-of-poverty or exclusion (% of male population) 21.9 23.4 23.5 26.0 27.3 28.4 27.9 b
At-risk-of-poverty (% of male population) 18.6 19.5 19.1 20.8 21.6 22.2 20.9 b
Poverty gap (%) 26.0 25.5 31.0 33.5 32.0 32.1 31.4 b
Persistent at-risk-of-poverty (% of male population) 9.6 10.1 11.7 11.1 10.4 11.1
Severe Material Deprivation (% of male population) 3.5 3.7 4.6 4.7 4.5 6.2 6.3
Share of people living in low work intensity households (% of males aged 0-59) 6.5 6.1 7.1 10.6 12.9 13.8 15.9
Life expectancy at birth (years) 77.9 78.2 78.7 79.1 79.5 79.5
Healthy life years at birth (years) 63.5 64.1 bd 62.9 64.4 65.4 64.8
Early leavers from education and training (% of males aged 18-24) 36.6 38.0 37.4 33.6 31.0 28.9 27.2
NEET: Young people not in employment, education or training 10.4 13.9 19.4 18.8 19.2 19.6 19.4
(% of males aged 15-24)
Female 2007 2008 2009 2010 2011 2012 2013
At-risk-of-poverty or exclusion (% of female population) 24.6 25.7 25.4 27.5 28.0 28.1 26.7 b
At-risk-of-poverty (% of female population) 20.8 21.9 21.1 22.1 22.7 22.1 19.9 b
Poverty gap (%) 25.1 23.3 27.4 30.5 30.4 30.9 30.3 b
Persistent at-risk-of-poverty (% of female population) 10.9 11.9 13.3 12.2 12.5 12.1
Severe Material Deprivation (% of female population) 3.6 3.5 4.4 5.1 4.6 5.5 6.1
Share of people living in low work intensity households (% of females aged 0-59) 7.1 7.0 8.0 11.1 13.8 14.8 15.4
Life expectancy at birth (years) 84.4 84.5 84.9 85.3 85.6 85.5
Healthy life years at birth (years) 63.2 63.6 bd 62.2 63.9 65.8 65.8
Early leavers from education and training (% of females aged 18-24) 24.7 25.1 24.1 22.6 21.5 20.5 19.8
NEET: Young people not in employment, education or training 13.7 14.6 16.7 16.8 17.3 17.6 17.8
(% of females aged 15-24)
By age
Children (0-17) 2007 2008 2009 2010 2011 2012 2013
At-Risk-of-poverty or exclusion of children (% of people aged 0-17) 28.6 30.6 30.0 33.1 33.2 33.8 32.6 b
At-risk-of-poverty (% of Children population) 26.2 28.2 26.8 29.2 29.5 29.9 27.5 b
Severe Material Deprivation (% of Children population) 4.4 5.5 6.7 7.4 5.2 7.6 8.3
Share of children living in low work intensity households (% of Children population) 5.0 4.3 6.1 9.5 11.6 12.3 13.8
Risk of poverty of children in households at work (Working Intensity > 0.2) 23.7 26.1 23.2 23.9 22.7 22.3 19.3 b
Impact of social transfers (excl. pensions) in reducing poverty (0-17) (%) 14.1 13.0 16.0 20.0 20.3 18.8 27.6
Working age (18-64) 2007 2008 2009 2010 2011 2012 2013
At-risk-of-poverty or exclusion (% of Working age population) 20.8 22.1 23.0 26.3 27.8 29.7 29.2 b
At-risk-of-poverty (% of Working age population) 16.4 17.3 17.5 19.5 20.8 21.9 20.4 b
Severe Material Deprivation (% of Working age population) 31 41 51 51 51 61 71
Very low work intensity (18-59) 7.3 7.3 8.0 11.2 13.9 14.9 16.3
In-work at-risk-of poverty rate (% of persons employed) 10.2 11.1 11.6 12.6 12.1 12.3 10.6 b
Impact of social transfers (excl. pensions) in reducing poverty (18-64) (%) 20.8 22.1 24.2 29.9 29.7 28.0 34.6
Elderly (65+) 2007 2008 2009 2010 2011 2012 2013
At-Risk-of-poverty or exclusion of elderly (% of people aged 65+) 27.8 27.7 24.3 21.4 20.9 16.6 14.5 b
At-risk-of-poverty (% of Elderly population) 26.1 26.9 23.1 20.5 19.5 14.8 12.7 b
Severe Material Deprivation (% of Elderly population) 3.6 1.9 2.3 2.2 2.7 2.9 2.7
Relative median income of elderly 0.79 0.79 0.82 0.86 0.86 0.93 1.0 b
(ratio with median income of people younger than 65)
Aggregate replacement ratio (ratio) 0.48 0.49 0.50 0.53 0.56 0.58 0.60 b
Expenditure in social protection indicators (% of GDP) 2007 2008 2009 2010 2011 2012 2013
Sickness/Health care 6.4 6.8 7.3 7.2 p 7.1 p 6.7 p
Disability 1.5 1.6 1.7 1.7 p 1.8 p 1.8 p
Old age and survivors 8.7 9.1 10.1 10.7 p 11.1 p 11.6 p
Family/Children 1.3 1.4 1.5 1.5 p 1.4 p 1.4 p
Unemployment 2.0 2.3 3.6 3.4 p 3.7 p 3.6 p
Housing and Social exclusion n.e.c. 0.4 e 0.4 e 0.4 e 0.5 e 0.4 e 0.4 e
Total (including Admin and Other expenditures) 20.8 22.0 25.2 25.5 p 26.0 p 25.9 p
of which: Means tested benefits 2.7 2.9 3.4 3.7 p 4.1 p 3.7 p
Notes: b = break in time series; d = definition differs, see metadata; e = estimated; f = forecast; p = provisional; s = Eurostat estimate; u = low reliability.
307