Page 163 - ePaper
P. 163
Chapter 3: The future of work in Europe: job quality and work organisation for a smart, sustainable and inclusive growth
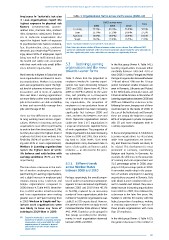
Employees in Tayloristic but also Table 3: Organisational forms across EWCS waves (2000–10)
in Lean organisations report the
highest exposure to physical risk EWCS survey wave Total
factors (environmental, posture- 2000 2005 2010
related risks, chemical risks, ambient Learning 39.1 %a 40.1 %a 36.8 %b 38.6 %
risks, dangerous substances). Employ- Lean 25.7 %a 27.2 %b 28.6 %c 27.2 %
ees in Tayloristic organisations also Tayloristic 18.6 %a 18.8 %a 18.3 %a 18.5 %
report the highest levels of exposure Simple 16.6 %a 13.9 %b 16.3 %a 15.8 %
to psychosocial risks factors (violence, Source: Eurofound estimates based on EWCS 2010 dataset.
fear, discrimination, stress, emotional Note: Subscripts denote whether difference between values across columns (from different EWCS
88
demands, poor leadership ( )). Interest- waves) are statistically significant at the 0.05 level. In particular, values having the same subscripts do
not differ significantly while values with different subscripts are significantly different.
ingly, about 90 % of employees report
being ‘very well’ or ‘well’ informed about
the health and safety risks associated
with their work with only small differ- 5.3. Declining Learning In the first group (Annex 4, Table A4.1),
ences between organisations. organisations and the move Learning organisations increased either
towards Leaner forms constantly between 2000 and 2010 or
Work intensity is highest in Tayloristic and since 2005. In Latvia, Portugal and Malta
Lean organisations and lowest in Learn- Table 3 shows that the proportion of this type of organisation increased between
ing organisations. Workers in Learning employees involved in Learning organi- 12 % and almost 20 % over the 10-year
and Lean organisations report the high- sations has been decreasing between period. Somewhat smaller increases are
est level of autonomy in terms of choos - 2005 and 2010 (down from 40.1 % in seen in Romania, Lithuania and Poland.
ing partners and in terms of applying 2005 to 36.8 % in 2010). At the same In the Netherlands, Denmark, Cyprus and
their own ideas. Learning organisations time, and probably as a consequence Estonia an initial decrease in the number of
are more likely to offer more sustainable of the decline of the number of Learn- Learning organisations between 2000 and
jobs in that workers are able and willing ing organisations, the proportion of 2005 was followed by an increase in the
to keep and successfully manage their employees in Lean production forms of following five years, bringing most of these
jobs until the age of 60. work organisation has been increasing countries back to the levels of 2000. In
significantly first between 2000 and the case of the Netherlands and Denmark,
There are few differences in exposure 2005, and then also between 2005 and these are among the highest in Europe:
to long working hours across organi- 2010. Tayloristic organisations remain 60 % of employees in private companies
sations. Workers in Learning and Lean stable over time: 1 in 5 organisations in with 10 and more employees work in
organisations most often report having Europe are structured in Tayloristic forms Learning organisations.
to work in their free time (around 11 %), of work organisation. The proportion of
but they also report the highest level of Simple organisations has been decreasing In the second group (Annex 4, Table A4.2),
employee-led short-term working time between 2000 and 2005, then increas- Learning organisations are decreasing
flexibility (56 % of workers in Learn- ing back to 2000 levels. Such trend while Lean organisations are increas-
ing and 40 % in Lean organisations). developments carry downward risks in ing, and these two trends are likely to
Workers in Learning organisations terms of job quality and human capital be related. This development is most
report the highest level of work- resilience — as discussed in the previ- prominent in Germany, Luxembourg,
life balance and satisfaction with ous subsection. Belgium and Austria. In Germany, for
working conditions (85 % and 90 % example, the difference in the proportion
respectively). of Learning and Lean organisations was
5.3.1. Different trends 31.5 percentage points in 2000, drop-
The data show a decrease in the num- across Member States ping to 15.8 percentage points in 2010.
ber of workers undergoing employer- between 2000 and 2010 A somewhat smaller drop in the propor-
paid training in Learning organisations, tion of workers employed in Learning
and a slight increase in employer-paid Perhaps surprisingly, the overall propor- organisations occurred in Slovenia, Italy
training among Lean, Tayloristic and tion of workers in Learning organisations and Finland. A more complex trend is pre -
Simple organisations compared to appears to have decreased significantly sent in Sweden and Ireland: they saw a
2000 (Annex 4, Table A4.9). Neverthe- between 2005 and 2010 (from 40.1 % steep increase in Learning organisations
less, in 2010 workers in both Learning to 36.8 %), replaced by an increasing from 2000 to 2005, then followed by
and Lean organisations were making number of Lean organisations, while the a decrease in the later five years. Yet,
greater use of self-paid training than number of Tayloristic organisations was Sweden is still the EU country with the
in 2000. Workers in Simple and Tay- stable (1 in 5 EU organisations). However, highest proportion of employees working
loristic work organisations were this general trend does not apply to each in Learning organisations — two out of
less likely to have any form of individual Member State (Annex 4, Tables three private organisations with more
training in 2010 than in 2000. A4.1–A4.4). Countries can be grouped in than 10 employees.
four groups according to the develop-
( ) Supportive leadership is most frequently ments in work organisation observed In the third group (Annex 4, Table A4.3),
88
reported by employees in Learning and Lean
organisations, contrasting lightly the rather between 2000 and 2010. the general decrease in the number of
negative picture of exposure to physical
and psychosocial risks in both Tayloristic
organisations.
161