Page 18 - Consumers and Mobile Financial Services 2014
P. 18
10 Consumers and Mobile Financial Services 2014
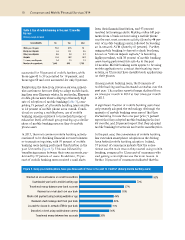
from their financial institution, and 43 percent
Table 3. Use of mobile banking in the past 12 months
by race received text message alerts. Making online bill pay-
ments from a bank account using a mobile phone
Percent, except as noted
was the next most common activity (done by 44 per-
Race/ethnicity No Yes Total cent of mobile banking users), followed by locating
an in-network ATM (done by 41 percent). Further,
White, non-Hispanic 73.8 62.5 70
Black, non-Hispanic 7.4 11.1 8.6 using mobile banking to deposit a check by phone,
Other, non-Hispanic 5.6 5.9 5.7 known as “remote deposit capture,” is becoming
Hispanic 11.8 19.2 14.3 highly prevalent, with 38 percent of mobile banking
2+ races, non-Hispanic 1.4 1.3 1.3 users having performed this activity in the past
Number of respondents 1,540 640 2,180
12 months. Mobile banking users appear to be using
mobile applications to conduct their banking trans-
accounted for 39 percent of mobile bankers, while actions, as 72 percent have installed such applications
those ages 45 to 59 accounted for 19 percent, and on their phones.
those ages 60 and over accounted for only 8 percent.
Among mobile banking users, the frequency of
Reinforcing the data from previous surveys, minori- mobile banking use has decreased somewhat over the
ties continue to be more likely to adopt mobile bank- past year. The median reported usage declined from
ing than non-Hispanic whites. In particular, Hispanic six times per month in 2012 to four times per month
mobile phone users show a disproportionately high in 2013.
rate of adoption of mobile banking (table 3), com-
prising 19 percent of all mobile banking users relative A significant fraction of mobile banking users have
to 14 percent of mobile phone users overall. Condi- only recently adopted the technology. Although the
tional on owning a mobile phone, use of mobile majority of mobile banking users report that they
banking remains unrelated to household income or started using it more than one year prior, 9 percent
education level, with each group making up a similar report that they adopted mobile banking in the last
share of mobile banking users as they do mobile six months, and 20 percent report that they adopted
phone users. mobile banking between six and twelve months prior.
In 2013, the most common mobile banking activity In the past year, the convenience of mobile banking
continued to be checking financial account balances has overtaken smartphone adoption as the driving
or transaction inquiries, with 93 percent of mobile force behind mobile banking adoption. Indeed,
banking users having performed this function in the 37 percent of consumers indicate that the conve-
past 12 months (figure 3). This was followed by nience was the main reason they started using mobile
transferring money between their own accounts, per- banking, compared to 32 percent of consumers who
formed by 57 percent of users. In addition, 53 per- said getting a smartphone was the main reason. A
cent of mobile banking users received e-mail alerts further 16 percent of consumers indicated that the
Figure 3. Using your mobile phone, have you done each of these in the past 12 months? (Among mobile banking users)
Checked an account balance or recent transactions 93%
Downloaded your bank's mobile banking app 72%
Transferred money between your bank accounts 57%
Received an e-mail alert from your bank 53%
Made a bill payment using banking website or app 44%
Received a text message alert from your bank 43%
Located the closest in-network ATM for your bank 41%
Deposited a check using mobile phone camera 38%
Transferred money between two accounts 26%