Page 13 - Consumers and Mobile Financial Services 2014
P. 13
March 2014 5
Box 1. The Unbanked, Underbanked, and Mobile Financial Services
In comparing results of the Board surveys for 2011, A further 8 percent of unbanked consumers don’t
2012, and 2013, the share of consumers who are believe that they would use an account enough to
unbanked has effectively remained constant over make it worthwhile, and 6 percent simply don’t like
the past few years. In 2011, 10.8 percent of con- dealing with banks (figure A).
sumers reported that neither they nor their spouse
or partner had a checking, savings, or money mar- The share of consumers who are underbanked—de-
ket account. In 2012, the share of unbanked con- fined as having a bank account but also using an
sumers was 9.5 percent of the adult population, and alternative financial service such as a payroll card,
in 2013, the share of unbanked consumers was payday lender, check casher, pawn shop, or auto
10.5 percent of the adult population. title loan—was 16.9 percent in 2013.
Both the unbanked and underbanked make signifi-
Of those currently unbanked, 34 percent report that
they had a bank account at some point in the past. cant use of mobile phones and smartphones.
Using data on those Board survey respondents Among individuals who are unbanked, 69 percent
observed in both 2012 and 2013, 40 percent of have access to a mobile phone and 49 percent of
those unbanked in 2012 had obtained a checking, these are smartphones. Among the underbanked,
savings, or money market account in 2013. Con- 88 percent have a mobile phone, 64 percent of
versely, 4 percent of those who had a bank account which are smartphones.
in 2012 no longer had an account in 2013. The underbanked population makes substantial use
of mobile banking. Almost 39 percent of the under-
Among unbanked consumers, the most important
reasons for not having a bank account were not banked with mobile phones report using mobile
having enough money (25 percent); simply not banking in the past 12 months, while 22 percent
needing or wanting one (24 percent); and being report using mobile payments.
unable to open an account due to ID, credit, or
banking history problems (10 percent).
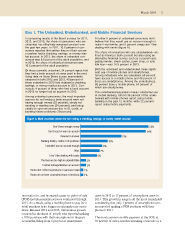
Figure A. Most important reason for not having a checking, savings, or money market account
Don't have enough money 25%
Don't need or want an account 24%
Refused to answer 15%
Banking history, credit, or ID problems 10%
I wouldn't use an account enough 8%
Other 7%
I don't like dealing with banks 6%
The fees are too high or unpredictable 2%
I cannot manage/balance an account 2%
Banks don't offer the products or services I need 1%
Banks do not have convenient hours or locations 1%
Innovation in, and increased access to, point-of-sale users in 2012 to 17 percent of smartphone users in
(POS) mobile payments services continued through 2013. This growth in usage is all the more remarkable
2013. As a result, using a mobile phone to pay for a considering that only 1 percent of smartphone own-
retail purchase is no longer an extremely rare occur- ers reported making a POS purchase with their
rence. Between 2012 and 2013, tremendous growth phone in 2011.
occurred in the share of people who reported making
a POS purchase with their smartphone in the past The most common mobile payment at the POS, at
12 months, rising from 6 percent of smartphone 39 percent of users, involves scanning a barcode or a
42 444