Page 28 - State of the Internship NoSeal
P. 28
Methodology
The data for the State of Internships 2014 were collected through a 35-question online survey,
conducted between March 27 and April 13, 2014. The 9,001 respondents used a self-administered,
online questionnaire via web-assisted interviewing software. To maintain the reliability and
integrity of the sample, each student was limited to one survey completion.
The sample was tested on key demographics, such as gender, region and ethnicity and slight
statistical adjustments were made to ensure respondents accurately mirrored the student
population.The resulting sample is a reliable nationwide cross-section of college students ranging
from freshmen to graduate students, as well as a small share of high school students. The margin of
error associated with the survey is 1.0 percent at the 95 percent confidence level. Percentage may not
always add to 100 percent due to rounding.
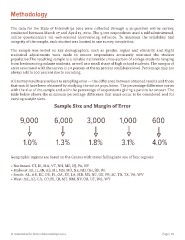
All survey results are subject to sampling error — the difference between obtained results and those
that would have been obtained by studying the entire population. The percentage difference varies
with the size of the sample and with the percentage of respondents giving a particular answer. The
table below shows the minimum percentage difference that must occur to be considered real for
varying sample sizes.
Sample Size and Margin of Error
9,000 6,000 3,000 1,000 600
1.0% 1.3% 1.8% 3.1% 4.0%
Geographic regions are based on the Census with states falling into one of four regions:
• Northeast: CT, RI, MA, VT, NH, ME, NJ, PA, NY
• Midwest: IA, IL, IN, KS, MI, MN, MO, NE, ND, OH, SD, WI
• South: AL, AR, DC, DE, FL, GA, KY, LA, MD, MS, NC, OK, PR, SC, TN, TX, VA, WV
• West: AK, AZ, CA, CO, HI, ID, MT, NM, NV, OR, UT, WA, WY
© InternMatch | State of Internships 2014 Page | 28
The data for the State of Internships 2014 were collected through a 35-question online survey,
conducted between March 27 and April 13, 2014. The 9,001 respondents used a self-administered,
online questionnaire via web-assisted interviewing software. To maintain the reliability and
integrity of the sample, each student was limited to one survey completion.
The sample was tested on key demographics, such as gender, region and ethnicity and slight
statistical adjustments were made to ensure respondents accurately mirrored the student
population.The resulting sample is a reliable nationwide cross-section of college students ranging
from freshmen to graduate students, as well as a small share of high school students. The margin of
error associated with the survey is 1.0 percent at the 95 percent confidence level. Percentage may not
always add to 100 percent due to rounding.
All survey results are subject to sampling error — the difference between obtained results and those
that would have been obtained by studying the entire population. The percentage difference varies
with the size of the sample and with the percentage of respondents giving a particular answer. The
table below shows the minimum percentage difference that must occur to be considered real for
varying sample sizes.
Sample Size and Margin of Error
9,000 6,000 3,000 1,000 600
1.0% 1.3% 1.8% 3.1% 4.0%
Geographic regions are based on the Census with states falling into one of four regions:
• Northeast: CT, RI, MA, VT, NH, ME, NJ, PA, NY
• Midwest: IA, IL, IN, KS, MI, MN, MO, NE, ND, OH, SD, WI
• South: AL, AR, DC, DE, FL, GA, KY, LA, MD, MS, NC, OK, PR, SC, TN, TX, VA, WV
• West: AK, AZ, CA, CO, HI, ID, MT, NM, NV, OR, UT, WA, WY
© InternMatch | State of Internships 2014 Page | 28